
Figure 4.
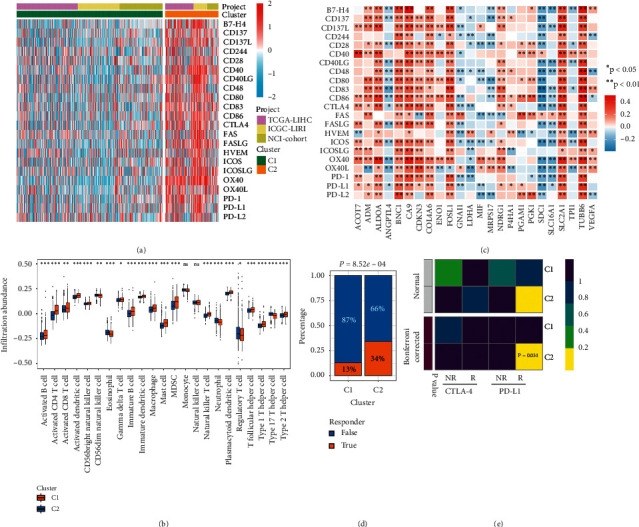
The difference of ICP expression, immune cells infiltration, and immunotherapy response between C1 and C2. (a) The expression heatmap of ICPs between C1 and C2 in metacohort. High expression, red; low expression, blue. (b) The abundance of 23 immune cell subsets infiltration was compared between the C1 and C2 in metacohort. ns, P > 0.05; ∗P < 0.05; ∗∗P < 0.01; ∗∗∗P < 0.001. (c) Correlations between immune checkpoints and HAGs in metacohort using Spearman analysis. Negative correlation was marked with blue, and positive correlation was marked with red. No asterisks represented no statistical significance; ∗P < 0.05; ∗∗P < 0.01. (d) Distribution of the immunotherapy response results predicted by TIDE algorithm between C1 and C2 in metacohort. Nonresponders, blue; responders, orange. (e) Submap analysis of the two subtypes and 47 previous melanoma patients with detailed immunotherapeutic information. NR represented nonresponders; R represented responders.