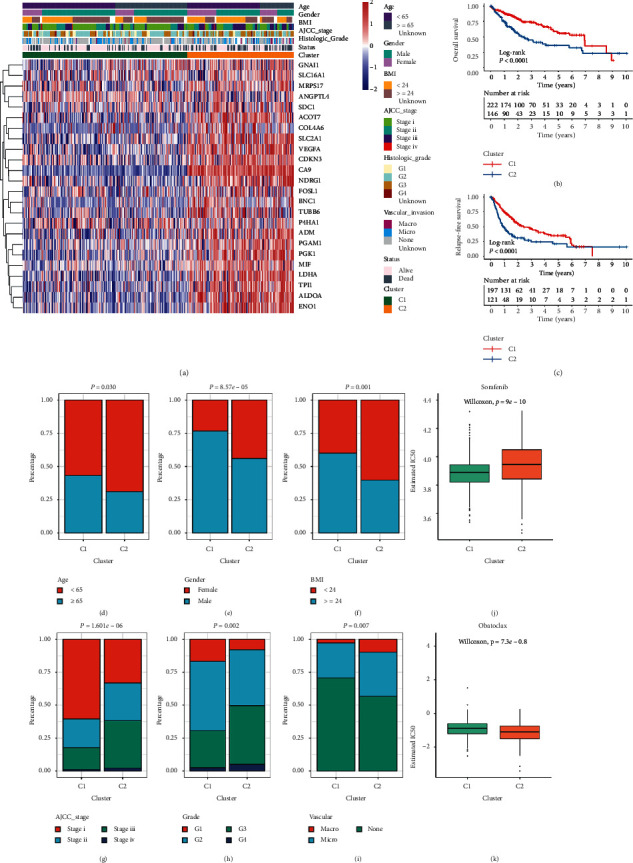
Figure 5.

The clinical characteristics and prognosis of hypoxia subtypes in TCGA cohort. (a) The expression heatmap of 24 HAGs in TCGA-LIHC cohort. Survival status, age, gender, BMI, vascular invasion, histology grade, AJCC stage, and hypoxia subtypes were displayed as patient annotations. (b, c) Kaplan–Meier curves of OS (b) and RFS (c) between C1 and C2 in TCGA-LIHC cohort. (d–f) Composition percentage of clinical characteristics such as age (d), gender (e), and BMI (f) between C1 and C2. (g–i) Composition percentage of AJCC stage (g), grade (h), and vascular invasion (i) between C1 and C2. (j, k) Distribution of the estimated IC50 of sorafenib (j) and obatoclax (k) between C1 and C2 in TCGA-LIHC cohort.
