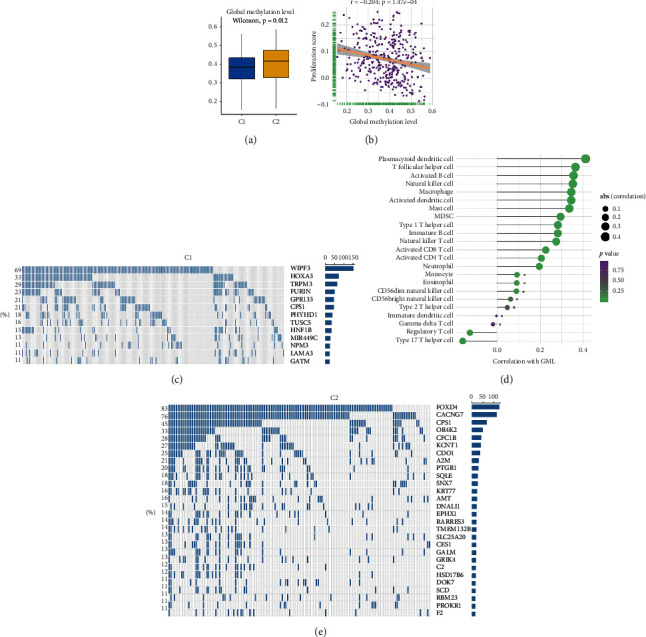
Figure 7.

The DNA methylation modification of two hypoxia subtypes in TCGA-LIHC cohort. (a) The distribution of global methylation level (GML) in two hypoxia subtypes. (b) The correlation between GML and proliferation score. (c) Spearman correlation analysis between GML and 23 immune cells. The circle size represented the strength of correlation. (d, e) The methylation-driven genes (MDGs) in C1 (d) and C2 (e). Each column represented individual patients. The percentage on the left showed the proportion of samples in the whole that this gene was identified as an MDG. The right bar plot indicated the total number of samples identified as an MDG in each gene.
