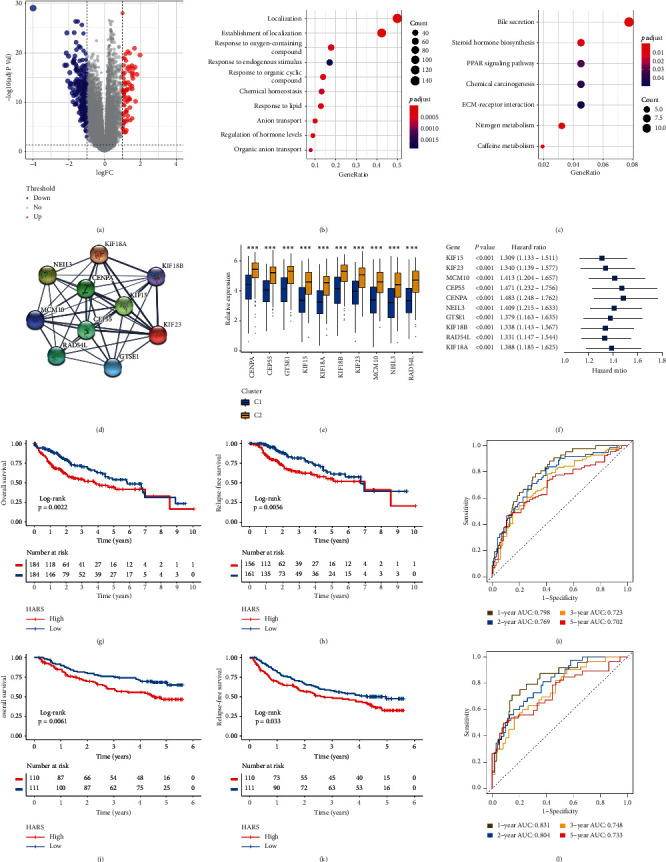
Figure 8.

The development and validation of HARS in TCGA-LIHC and NCI cohorts. (a) Volcano plot displayed the differentially expressed genes (DEGs) between the two subtypes. Red dots represented upregulated genes, blue dots represented downregulated genes, and grey dots represented genes with no significance. (b, c) GO (b) and KEGG (c) enrichment analysis of 299 DEGs. The significantly biological functions were extracted with adjusted P value < 0.05. (d) Using MCODE plug-in of Cytoscape software, we extracted a key module including 10 genes. (e) The expression difference of 10 key genes between C1 and C2. ∗∗∗P < 0.001. (f) Univariate Cox regression analysis revealed the prognosis significance of 10 key genes, all of them were risk factors. (g, h) Kaplan–Meier curves for OS (g) and RFS (h) between low HARS and high HARS groups in TCGA-LIHC cohort. (i) Estimation of the prognosis prediction by receiver operating characteristic curve (ROC) in TCGA-LIHC cohort. (j, k) Kaplan–Meier curves for OS (j) and RFS (k) between low HARS and high HARS groups in NCI cohort. (l) Estimation of the prognosis prediction by ROC in NCI cohort.
