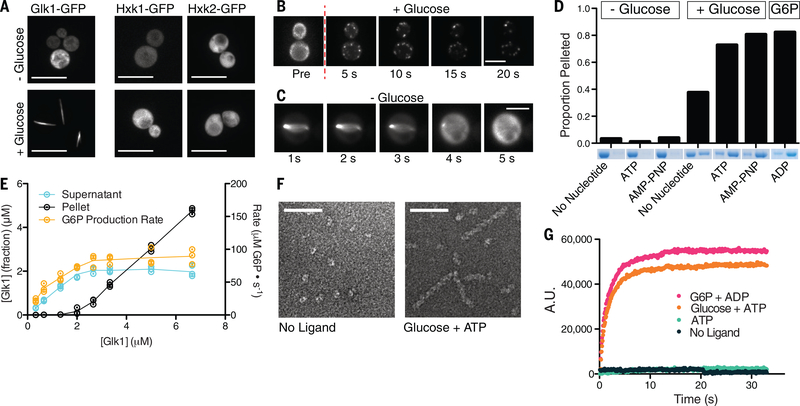
Fig 1. Glk1 forms filaments in response to its substrates at high enzyme concentration.
A) Fluorescence images of stationary phase Glk1-msfGFP (left), Hxk1-msfGFP (middle), and Hxk2-msfGFP (right) cells before (top) or after (bottom) glucose addition. Scale bars: 10 μm. B, C) Fluorescence images Glk1-msfGFP cells from a time-lapse video as glucose is added (top) or removed (bottom). Puncta in B eventually coalesce into a single, filamentous structure as in A and C. Scale bars: 5 μm. D) Purified Glk1 was ultracentrifuged at 436k x g for 30 min with different ligand combinations. The supernatant (left) and pellet (right) of each condition were subjected to SDS-PAGE. E) Purified Glk1 concentration was varied in saturating glucose and ATP and assayed for enzyme activity (glucose-6-phosphate production rate) or ultracentrifuged. The concentration of Glk1 in the supernatant and pellet was measured. N = 3. Means are connected by lines. F) Electron micrographs of negative-stained samples: 7.5 μM Glk1 in the absence of ligands (left) or in saturating glucose and ATP (right). Scale bar: 50 nm. G) 90-degree light scattering of 7.5 μM Glk1 mixed with different ligand combinations.

