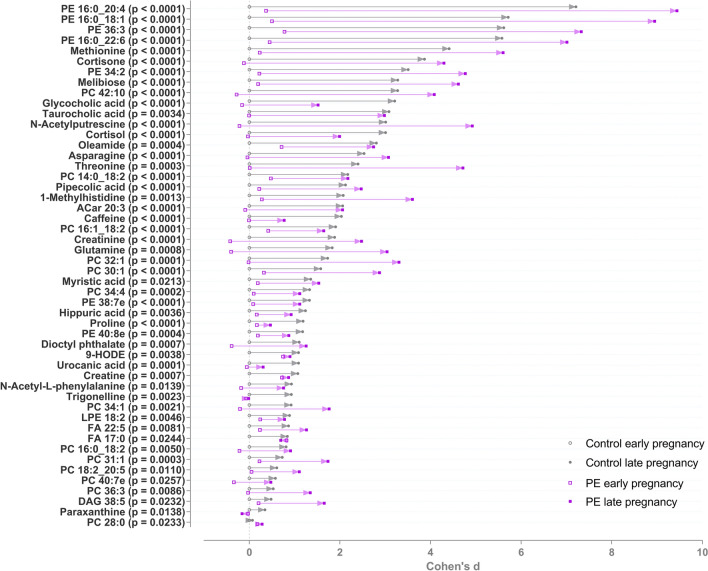
Fig. 1.
Metabolites increased in pre-eclamptic and control women from early to late pregnancy. All metabolites shown are significant after false discovery rate correction for multiple testing. Cohen’s d values when compared to early pregnancy control samples and raw p-values from linear mixed model analysis are shown. The d-value shows the mean difference divided by standard deviation compared to mean metabolite level in the control group 1st trimester samples. Positive d-value means that the increased, and negative that they were decreased, when compared to the 1st trimester samples from the control group. The level of identifications for each metabolite can be found in the Supplementary Table 1. PE phosphatidylethanolamine, PC phosphatidylcholine, ACar acylcarnitine, LPE lysophosphatidylethanolamine, FA fatty acid, DAG diacylglyceride

