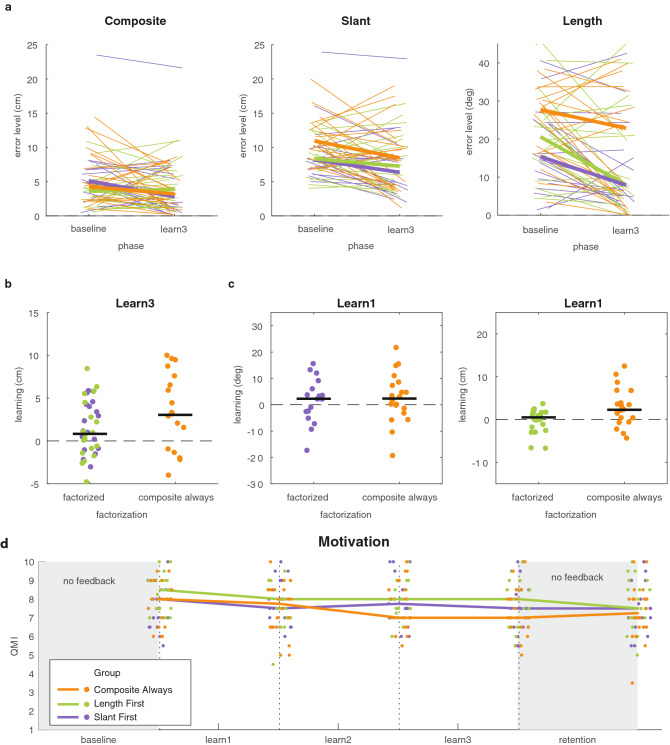
Figure 3.
Results on learning in Experiment 1. (a) Error level in the baseline phase and the third learning phase for the multidimensional task and the chosen factors. Thin lines represent individual participants whereas the thick lines represent the group median. (b) Learning of the multidimensional task in the third learning phase for the groups that received factorized feedback and the group that received composite feedback. (c) Learning of slant and length in the first learning phase. Dots represent individual participants and the black lines represents the median across participants. (d) Motivation in the three groups as a function of phase number, measured with the Quick Motivation Index that asked about enjoyment and motivation to continue (QMI; van der Kooij et al., 2019). Dots indicate the individual participants; the lines connect the median of each group. For each participant, the horizontal position of the data is the same across all panels.

