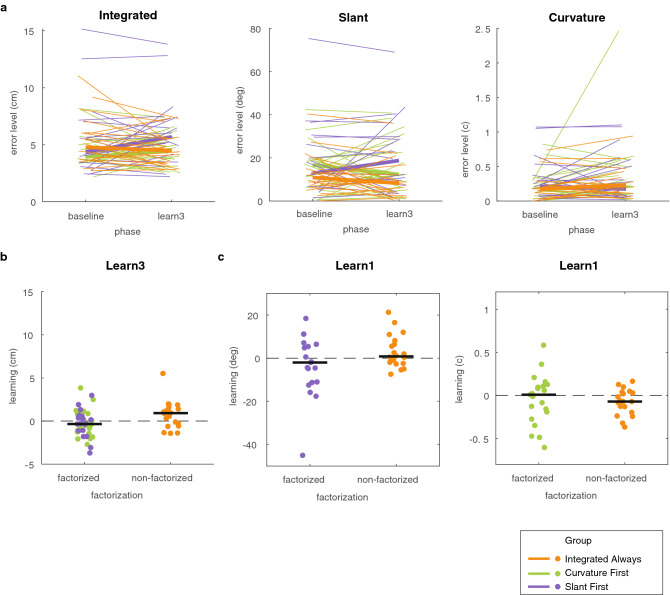
Figure 7.
Results on learning in Experiment 2. (a) Error level in the baseline phase and the third learning phase for the three different groups. Thin lines represent individual participants whereas the thick lines represent the group median. (b) Learning of the multidimensional task in the third learning phase. (c) Learning of the slant (left panel) and curvature (right panel) factor in the first learning phase. Dots represent individual participants and the black line represents the median across participants. Dots represent individual participants and the black line represents the median across participants. All subfigures use the same scatter in the x-position of the dots.

