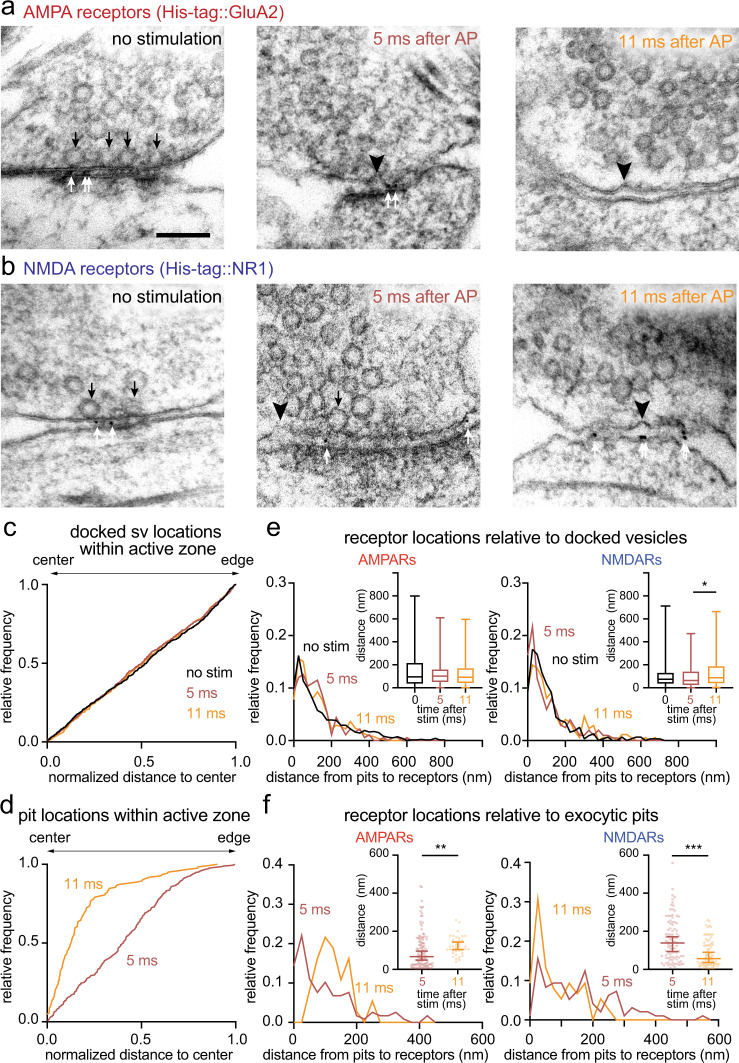
Fig. 3. Synchronous and asynchronous release are aligned to AMPA and NMDA receptors, respectively.
Example transmission electron micrographs of synapses after SMASH labeling and high-pressure freezing at the indicated time points after an action potential (AP), showing pits (black arrowheads), docked vesicles (black arrows), and gold particles (white arrows) at synapses of wild-type neurons expressing His-tag::GluA2 (a) and His-tag::NR1 (b). Cumulative relative frequency distribution of lateral distances between docked vesicles (c) or exocytic pits (d) and the active zone center at 5 or 11 ms after stimulation, as measured within 2D profiles by transmission electron microscopy. Exocytic pits were biased toward the center both at 5 ms (median = 0.4, p < 0.001, n = 286 pits, N = 7 samples) and 11 ms (median = 0.13, p < 0.001, n = 124 pits, N = 7 samples), but pits at 11 ms were strongly biased toward the center (p < 0.001, Kolmogorov–Smirnov D test). Bias of vesicles and pits locations toward the center or edge of the active zone in (c, d) was tested by comparing each group to a theoretical median of 0.5 using one-sample two-tailed Wilcoxon signed-rank tests. Relative frequency distribution of lateral distances between docked vesicles (e) or exocytic pits (f) and gold particles within the cleft at 5 ms (red) and 11 ms (orange) after stimulation. Insets: the same data plotted as box and whiskers for docked vesicles (e) and scattered dots for pits (f) to show the median distances. Error bars: median and 95% confidence interval for the scattered dot plots. Kolmogorov–Smirnov D tests were performed in each case, with additional post hoc Dunn’s multiple comparisons tests for docked vesicle data. *p < 0.05, **p < 0.01, ***p < 0.001. Experiments were repeated three times independently. Scale bar: 100 nm. See Supplementary Data Table 1 for full pairwise comparisons and summary statistics.

