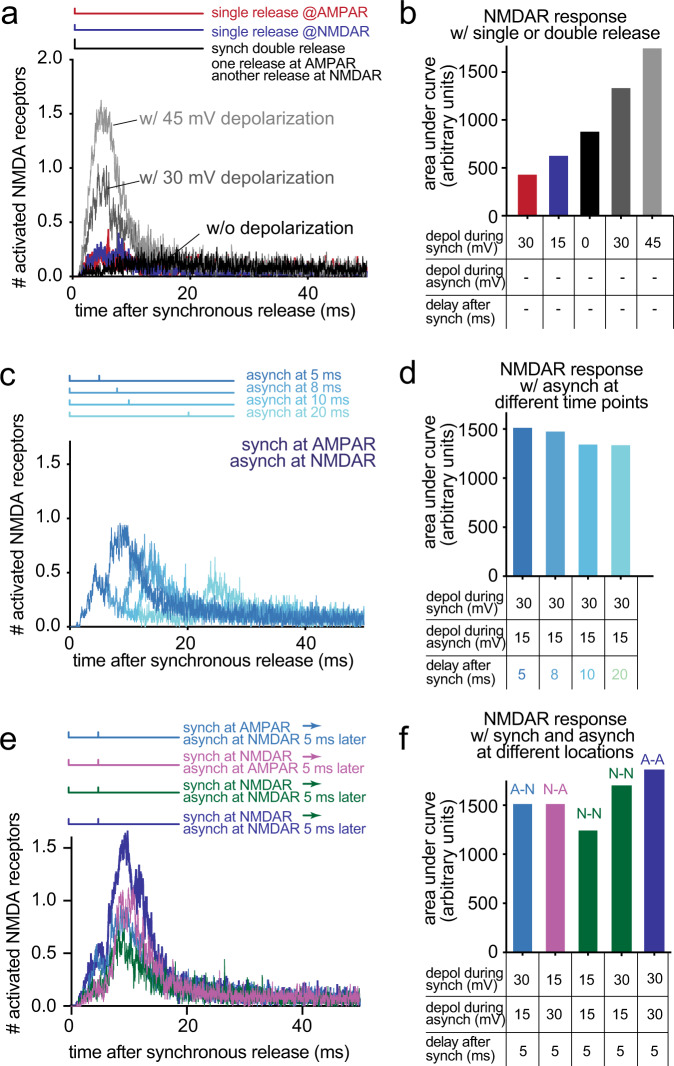
Fig. 4. Computer simulations predict better activation of NMDA receptors with asynchronous release.
a Time course of simulated NMDA receptor activation, resulting from one or two release events at the indicated locations while varying the degree of depolarization of the postsynaptic membrane. The number averaged from 48 simulations is plotted. The vertical lines in the diagrams shown above the plot indicate when synchronous and asynchronous release occur. Synchronous release always occurs at time 0. Double release means two release events happen simultaneously. Synch synchronous, Asynch asynchronous. b The area under curve calculated from each data set in (a) and plotted as a bar graph. The locations of release are described in (a), and the degree of depolarization (depol) and the delay between synchronous and asynchronous release used in simulations are listed at the bottom. c Same as (a), but varying the interval between two release events. d Same as (b), but plotted from each data set in (c). e Same as in (a), but varying the order of the release. f Same as in (b), but plotted from each data set in (e) and plotted as a bar graph. A-N: synchronous release at AMPA receptors and asynchronous release at NMDA receptors. N-A: synchronous release at NMDA receptors and asynchronous release at AMPA receptors. N-N: both synchronous and asynchronous release at NMDA receptors. A-A: both synchronous and asynchronous release at AMPA receptors.

