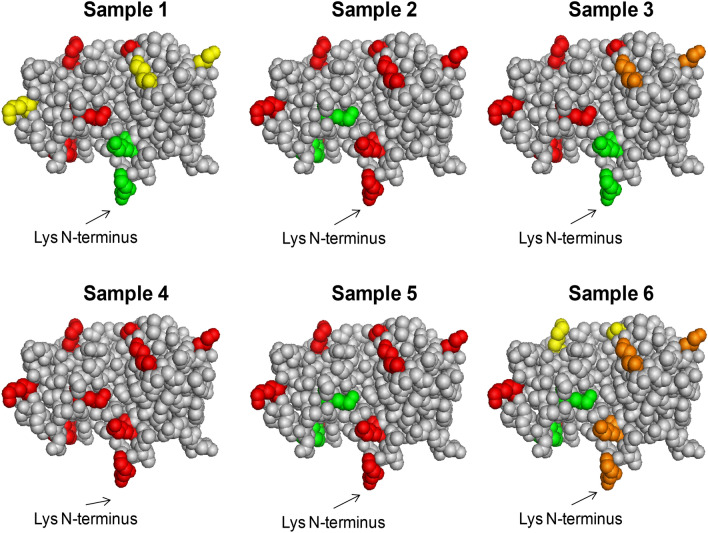
Figure 3.
Analytical characterization of Samples 1–6. Relative abundance of Lys residues obtained by peptide mapping of free amino acids in RNase A conjugated with different scaffolds: glyoxyl-agarose (sample 1), CDI-agarose (sample 2), GPTS-agarose (sample 3), glutaraldehyde-agarose (sample 4), APTS-glutaraldehyde-agarose (sample 5) and CNBr-agarose (sample 6). Colors indicate the percentage abundance of each Lys residue normalized respect to the most abundant peptide in the corresponding analysis. The following legend was used: red 0–20%; orange 20–40%; yellow 40–60%; green 60–100%. Consequently, red = Lys bound to the carrier; green = Lys exposed on the surface, not involved in the binding. Created with PyMOL Molecular Graphics System (version 1.1 eval, http://www.pymol.org).

