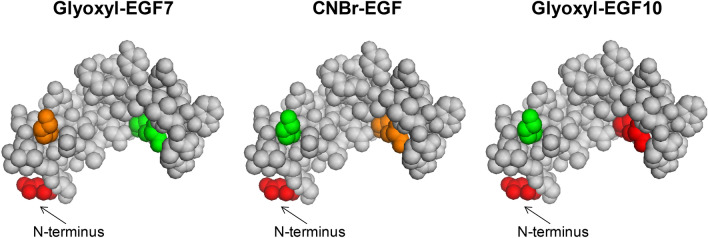
Figure 5.
Relative abundance of N-terminus and Lys residues obtained by peptide mapping of free amino acids in EGF immobilized on different carriers. Colors indicate the percentage abundance of each residue. The following legend was used: red 0–20%; orange 20–40%; yellow 40–60%; green 60–100%. Consequently, red = Lys bound to the carrier; green = Lys exposed on the surface, not involved in the binding. Created with PyMOL Molecular Graphics System (version 1.1 eval, http://www.pymol.org).

