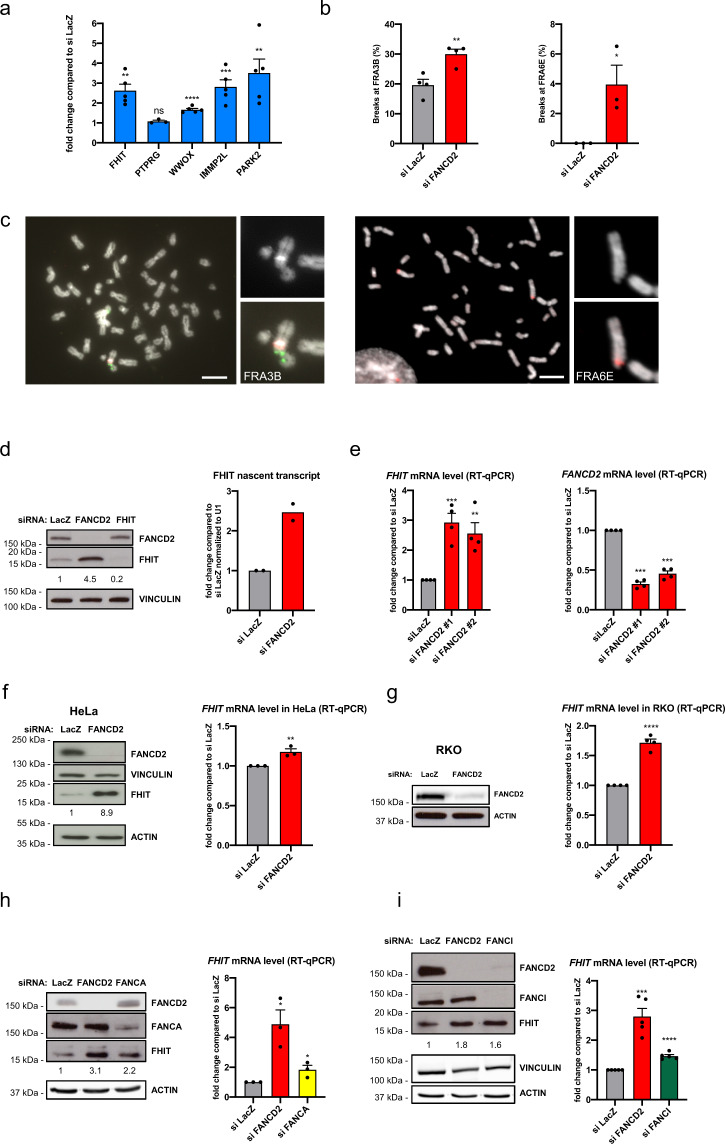
Fig. 1. FANCD2 depletion induces CFS gene expression.
a mRNA levels of large CFS genes measured by RT-qPCR after siFANCD2 transfection, compared to levels after siLacZ transfection. n = 5 (FHIT, WWOX, IMMP2L, PARK2), n = 3 (PTPRG) independent experiments. **p = 0.0011 (FHIT), ****p < 0.0001, ***p = 0.0009, **p = 0.0067 (PARK2). b Frequency of FRA3B and FRA6E breakage presented as the percentage of chromosome 3 and chromosome 6 homologs, with breaks at FRA3B and FRA6E, respectively. n = 4 and n = 3 independent experiments for FRA3B and FRA6E breakage, respectively. **p = 0.0064, *p = 0.0377. c Left, example of FISH analysis of metaphase spread from siFANCD2-transfected cells after treatment with 0.3 µM APH stained for DNA (DAPI, grayscale), a centromeric probe for chromosome 3 (red) and a FHIT/FRA3B FISH probe (green). Right, example of FISH analysis of metaphase spread from siFANCD2-transfected cells after treatment with 0.3 µM APH stained for DNA (DAPI, grayscale), and a PARK2/FRA6E FISH probe (red). Scale bars, 10 μM. d Western blot of whole-cell lysate of control, FANCD2, and FHIT siRNA-transfected HCT116 cells showing the increased FHIT protein level in FANCD2-depleted cells (left). Cells were transfected with siRNA against FHIT as a specificity control for the FHIT antibody. The relative increase of FHIT protein level is reported under the corresponding band. Quantification of nascent EU-labeled FHIT transcripts after control or FANCD2 siRNA transfection by RT-qPCR normalized to U1 (RNU1-1) RNA gene expression (right). n = 2 independent experiments. e RT-qPCR analysis of FHIT expression using two independent FANCD2 siRNAs (left). FANCD2 downregulation was estimated by RT-qPCR (right). n = 4 independent experiments. ***p = 0.0008, **p = 0.0048. f Western blot of whole-cell lysate of control and FANCD2 siRNA-transfected HeLa cells (left). The relative increase of FHIT protein level is reported under the corresponding band. mRNA levels of FHIT measured by RT-qPCR after treatment with control or FANCD2 siRNA (right). n = 3 independent experiments. **p = 0.0089. g Western blot of whole-cell lysate of control and FANCD2 siRNA-transfected RKO cells (left). Note that RKO cells expressed very low levels of FHIT and that FHIT protein was not detected by Western blot in this cell line. Quantification of FHIT mRNA levels by RT-qPCR after treatment of cells with control or FANCD2 siRNA (right). n = 4 independent experiments. ****p < 0.0001. h FHIT expression increases after FANCD2 and FANCA depletion in HCT116 cells relative to the control, observed at the protein level by Western blot (left) and the mRNA level by RT-qPCR (right). The relative increase of FHIT protein level is reported under the corresponding band. n = 3 independent experiments. *p = 0.0147 (siFANCD2), *p = 0.0459 (siFANCA). i FHIT expression increases after FANCD2 and FANCI depletion in HCT116 cells relative to the control, observed at the protein level by Western blot (left) and the mRNA level by RT-qPCR (right). The relative increase of FHIT protein level is reported under the corresponding band. n = 5 independent experiments. ***p = 0.0002, ****p < 0.0001. Error bars are standard error of the mean (SEM).

