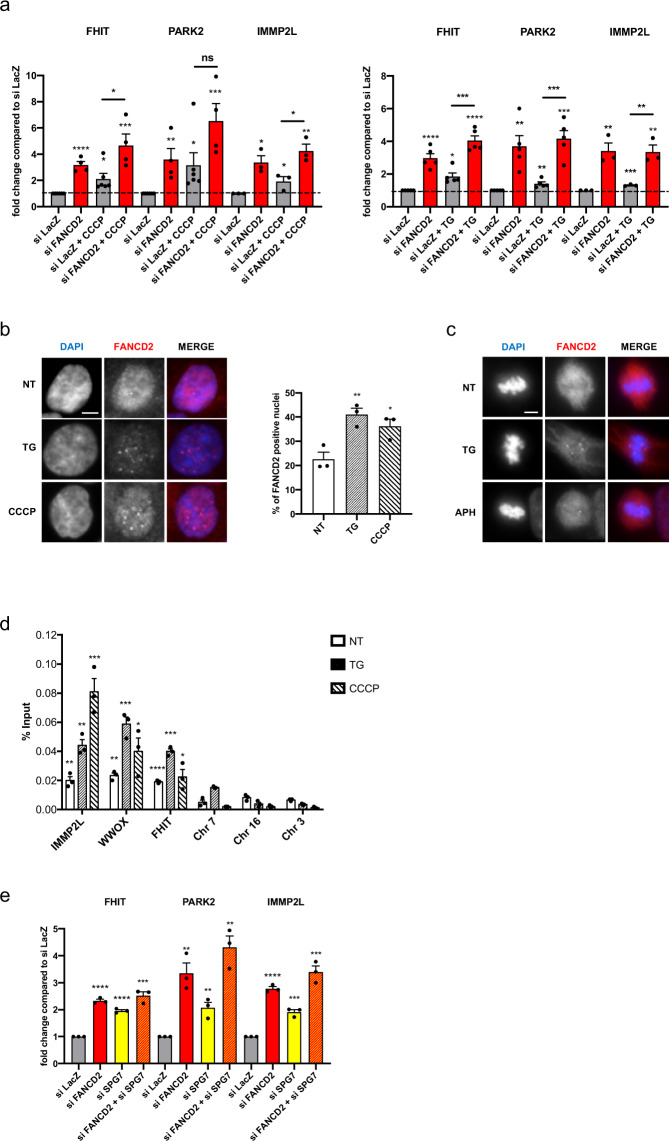
Fig. 5. Mitochondrial stress triggers CFS gene expression and FANCD2 binding at CFSs.
a Left, RT-qPCR-based analysis of CFS gene expression in siLacZ- and siFANCD2-transfected cells treated or not with 10 µM CCCP for 8 h. Right, RT-qPCR-based analysis of CFS gene expression in siLacZ- and siFANCD2-transfected cells treated or not with 1 µM TG for 8 h. n = 6 (FHIT_siLacZ), n = 4 (FHIT_siFANCD2), n = 6 (FHIT_siLacZ_CCCP), n = 4 (FHIT_siFANCD2_CCCP), n = 6 (PARK2_siLacZ), n = 4 (PARK2_siFANCD2), n = 6 (PARK2_siLacZ_CCCP), n = 4 (PARK2_siFANCD2_CCCP), n = 3 (IMMP2L) independent experiments for cells treated or not with CCCP; and n = 5 (FHIT), n = 4 (PARK2), n = 3 (IMMP2L) for cells treated or not with TG. ****p < 0.0001 (FHIT_siFANCD2), *p = 0.0207 (FHIT_siLacZ_CCCP), ***p = 0.0007 (FHIT_siFANCD2_CCCP), *p = 0.0174 (FHIT_siFANCD2_CCCP vs. FHIT_siLacZ_CCCP), **p = 0.0048 (PARK2_siFANCD2), *p = 0.047 (PARK2_siLacZ_CCCP), ***p = 0.0008 (PARK2_siFANCD2_CCCP), *p = 0.0104 (IMMP2L_siFANCD2), **p = 0.0037 (IMMP2L_siFANCD2_CCCP), *p = 0.023 (IMMP2L_siFANCD2_CCCP vs. IMMP2L_siLacZ_CCCP); ****p < 0.0001 (FHIT_siFANCD2), *p = 0.0038 (FHIT_siLacZ_TG), ****p < 0.0001 (FHIT_siFANCD2_TG), ***p = 0.0003 (FHIT_siFANCD2_TG vs. FHIT_siLacZ_TG), **p = 0.003 (PARK2_siFANCD2), **p = 0.0058 (PARK2_siLacZ_TG), ***p = 0.0002 (PARK2_siFANCD2_TG), ***p = 0.0006 (PARK2_siFANCD2_TG vs. PARK2_siLacZ_TG), **p = 0.008 (IMMP2L_siFANCD2), ***p = 0.0006 (IMMP2L_siLacZ_TG), **p = 0.0052 (IMMP2L_siFANCD2_TG), **p = 0.0087 (IMMP2L_siFANCD2_TG vs. IMMP2L_siLacZ_TG). b Left, examples of immunofluorescence staining of FANCD2 in cells treated with TG or CCCP or in cells that were not treated (NT); FANCD2 is shown in red, and DNA (DAPI) is in blue in the merged image. Right, percentage of FANCD2-positive nuclei; FANCD2 foci were counted in a total of 335 (NT), 318 (TG), and 330 (CCCP) nuclei from n = 3 independent experiments, and nuclei with more than five spots were quantified. Scale bars, 5 μM. c Immunofluorescence staining of FANCD2 in metaphase cells treated or NT with TG or APH. Scale bars, 5 μM. d FANCD2 ChIP followed by qPCR in cells treated or not with 1 µM TG or 10 µM CCCP for 8 h. The results are expressed as the percentage of the input. Chromosome 7 (Chr 7), Chromosome 16 (Chr 16), and Chromosome 3 (Chr 3) were used as control regions close to the IMMP2L, WWOX, and FHIT genes, respectively. n = 3 independent experiments. **p = 0.0084 (IMMP2L_NT), **p = 0.002 (IMMP2L_TG), ***p = 0.001 (IMMP2L_CCCP), **p = 0.002 (WWOX_NT), **p = 0.0004 (WWOX_TG), *p = 0.139 (WWOX_CCCP), ****p < 0.0001 (FHIT_NT), ****p < 0.0001 (FHIT_TG), *p = 0.161 (FHIT_CCCP). e Expression of large CFS genes measured by RT-qPCR after control, FANCD2, SPG7, or FANCD2 and SPG7 siRNA transfection. n = 3 independent experiments. ****p < 0.0001 (FHIT_siFANCD2), ****p < 0.0001 (FHIT_siSPG7), ***p = 0.0004 (FHIT_siFANCD2 + siSPG7), **p = 0.0036 (PARK2_siFANCD2), **p = 0.0066 (PARK2_siSPG7), **p = 0.0014 (PARK2_siFANCD2 + siSPG7), ****p = 0.0001 (IMMP2L_siFANCD2), ***p = 0.0006 (IMMP2L_siSPG7), ***p = 0.0005 (IMMP2L_siFANCD2 + siSPG7). Error bars are standard error of the mean (SEM).

