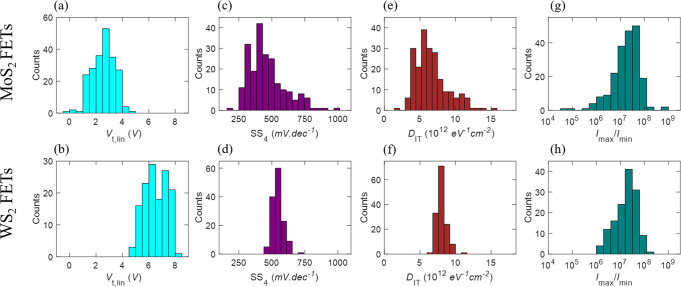
Fig. 4. Variation in OFF-state performance.
Histograms showing the variation in threshold voltage extracted using linear extrapolation (Vt,lin) for a MoS2 and b WS2 FETs. The median values for these extracted threshold voltages were found to be more positive for WS2 FETs compared to MoS2 FETs due to higher intrinsic n-type doping of MoS2. Histograms of SS extracted across 4 orders of magnitude change in the drain current (SS4) for c MoS2 and d WS2 FETs. The deviation of SS from the ideal 60 mV.dec−1 corresponds to the presence of interface traps. Histograms of interface trap density (DIT) for e MoS2 and f WS2 FETs calculated from SS4. Histograms of maximum to minimum current ratio (Imax/Imin) for g MoS2 and h WS2 FETs.

