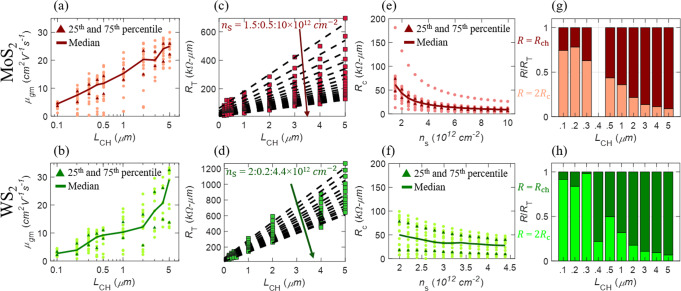
Fig. 5. Device-to-device variation in field-effect mobility and contact resistance.
Distribution of mobility extracted using peak transconductance () for different channel lengths for a MoS2 and b WS2 FETs. Median, 25th percentile, and 75th percentile is also denoted. Total resistance (RT) versus LCH for c MoS2 and d WS2 for different carrier concentrations (nS) extracted using a representative TLM structure. The distribution of contact resistance (Rc) across multiple TLM structures, extracted from the y-intercepts in c and d, as a function of nS for e MoS2 and f WS2, respectively. The relative contribution of Rc and channel resistance (Rch) to the total resistance for g MoS2 and h WS2 for different LCH. In scaled devices, as Rch scales with the channel length, the contribution of Rc (note that Rc is independent of LCH), i.e., 2Rc/RT, is more significant compared to Rch, i.e., Rch/RT.

