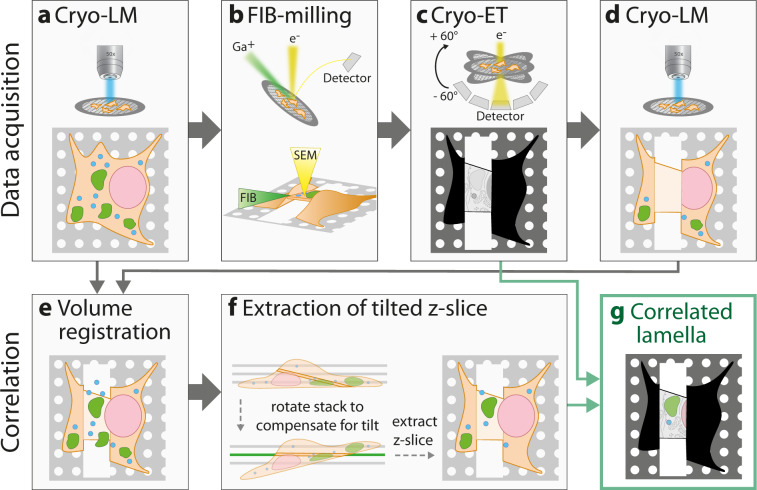
Fig. 1. Schematic workflow for post-correlation on-lamella cryo-CLEM.
The workflow consists of two parts: data acquisition (a–d) and data processing for correlation analysis (e–g). Structures in cells grown on EM grids are fluorescently labeled prior to vitrification by plunge-freezing. a In the first step, the vitrified sample is mapped by cryo-LM, acquiring Z-stacks with a 300 nm spacing. b In the second step, labeled cells are thinned by cryo-FIB-milling to produce lamellae of 150–200 nm thickness. c Lamellae are mapped by cryo-TEM and tilt series of areas of interest are acquired. d FIB-milled areas are mapped again by cryo-LM to retrieve the exact position of the lamellae. For both Z-stacks of step (a) and step (d), deconvolution is performed to increase the resolution (not shown in the figure). e To combine the information of the fluorescent signal from step (a) and the lamella position from step (d), both Z-stacks are aligned using an automated 3D registration algorithm. After image registration, the transmitted light brightfield (TL-BF) channel of step (d) is combined with the fluorescent channels of step (a) leading to a combination of lamella position and fluorescent signal in a single composite Z-stack. f To compensate for lamella tilt, the tilt is measured using the TL-BF signal, the Z-stack is rotated accordingly and a Z-slice corresponding to the lamella is extracted. g Finally, the extracted Z-slice is registered to the cryo-TEM map from step (c).

