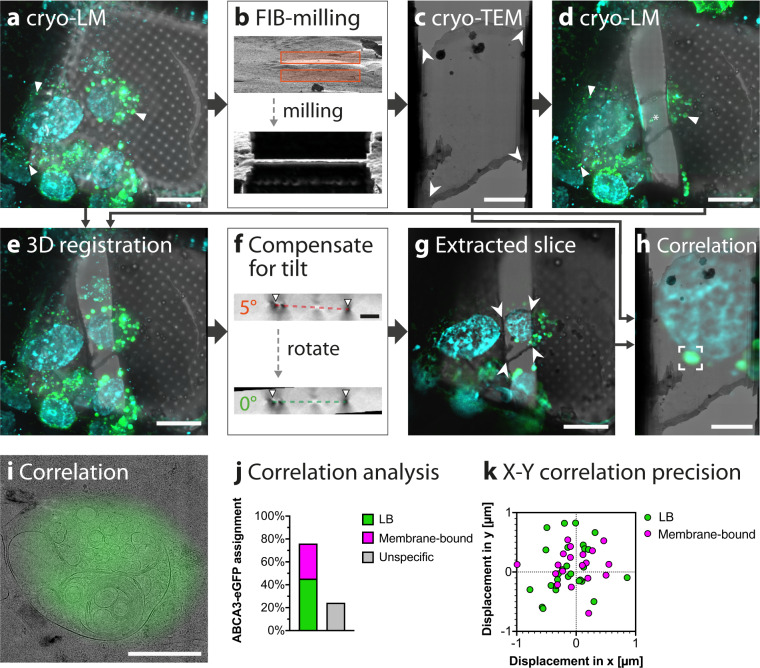
Fig. 2. Post-correlation on-lamella cryo-CLEM allows the identification of LB-like structures.
A549 cells grown on EM grids were transiently transfected with ABCA3-eGFP and nuclei and lipid droplets were fluorescently labeled prior to plunge- freezing. a MIP of the deconvolved cryo-LM stack acquired before FIB-milling. ABCA3-eGFP is shown in green, and nuclei and lipid droplets are shown in cyan. b Angled FIB image showing the same region before and after milling, respectively. c Stitched cryo-TEM map of the lamella produced by FIB milling acquired at 8,700× magnification. White arrowheads show landmarks used for correlation. d MIP of the deconvolved cryo-LM stack acquired after TEM imaging. The fluorescent signal in the cell body remains visible (arrows). Ice contamination on the lamella (asterisk) shows autofluorescence which is detectable in all fluorescent channels and thus is not emitted from ABCA3-eGFP. e MIP of the registered and aligned image stack. f Z–Y slice showing the lamella tilt corresponding to the FIB milling angle (top) and Z–Y slice after rotation of the Z-stack by 5°. The organometallic platinum coated edges of the lamella (arrows) can be seen as dark dots in the Z–Y-slice. g Extracted Z-slice corresponding to the plane of the lamella with computationally removed out-of-lamella fluorescent signal. White arrowheads indicate landmarks overlaid with those in (c). h Overlay showing the product of the nonrigid alignment between the TEM map in panel (c) and the fluorescence image in panel (g). i High magnification image of the correlated lamella. j Quantification of correlation with membrane-bound organelles. A total of 62 distinct correlated eGFP signals of 6 lamellae were assigned to corresponding structures of the cryo-TEM map. Twenty-eight ABCA3-eGFP signals were assigned to LBs, 19 to membrane-bound organelles, and 15 could not be assigned to any structure. k Quantification of the correlation precision. For the 47 successfully correlated structures, the distance and angle to the center of the corresponding ABCA3-eGFP signal were measured and shown in a radar plot. The average correlation precision is 450 nm (SD = 249 nm). Scale bars: a, d, e, g 20 µm, c, f, h 5 µm, i 1 µm.

