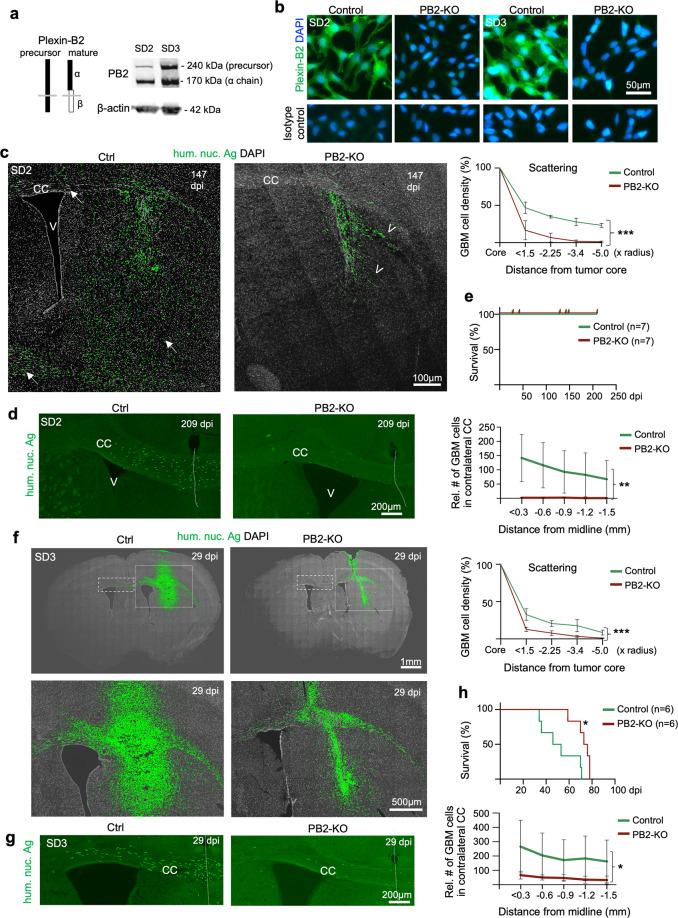
Fig. 2. Plexin-B2 ablation limits GBM spread.
a Diagram illustrating structure of Plexin-B2 precursor and mature form (during maturation, Plexin-B2 is cleaved into a non-covalently linked complex of α and β chains). WB with an antibody against the extracellular domain of Plexin-B2 shows a robust expression of Plexin-B2 in SD2 and SD3 GSCs. Note that cells typically express both precursor and mature forms of Plexin-B2, hence the double band pattern. b IF images of cultured GSCs demonstrate the absence of surface expression of Plexin-B2 (PB2) in cells with CRISPR KO. IF images of cells stained with isotype IgG control are shown in the bottom panels. c IF images of coronal brain sections with SD2 GSC transplants at 147 days post injection (dpi). Note the diffuse infiltration of tumor cells (hum. nuc. Ag+) in striatum and corpus callosum (CC) (arrows) in the control transplant, while PB2-KO GBM cells were mainly confined near the injection site. Also note tumor cell aggregation in collective migration streams at the tumor periphery in PB2-KO transplant (arrowheads), in contrast to the diffuse invasion pattern in control transplant. Quantifications on the right show the relative density of GBM cells (normalized to tumor core) in rings of increasing radius from the tumor core. n = 3 mice per genotype. Two-way ANOVA, ***P < 0.001. d IF images of the CC region show abundant tumor cells (hum. nuc. Ag+) crossing midline (dotted line) in control transplant at 209 dpi, but much fewer detectable tumor cells in contralateral CC in PB2-KO transplant. Quantifications show the relative abundance of GBM cells found in segments of 0.3 mm increment in contralateral CC. n = 4 mice per genotype. Two-way ANOVA, **P < 0.01. e Kaplan–Meier survival curves of mice transplanted with control or PB2-KO SD2 GSCs. No mice died for up to 209 dpi for either cohort (n = 7 mice per cohort), reflecting slow tumor expansion of SD2 GSCs in vivo. f IF images of coronal brain sections from mice transplanted with SD3 GSCs at 29 dpi. GBM cells with PB2-KO were more restricted in their infiltration than control cells. Quantifications on the right show the relative density of GBM cells (normalized to tumor core) in rings of increasing radius from the tumor core. n = 3 mice per genotype. Two-way ANOVA, ***P < 0.001. g Enlarged images of contralateral CC are shown for SD3 transplant. Midline is denoted by a dotted line. Quantifications show the relative abundance of GBM cells found in segments of 0.3 mm increment in contralateral CC. n = 3 mice per genotype. Two-way ANOVA, *P < 0.05. h Kaplan–Meier survival analysis shows that mice bearing intracranial transplants of PB2-KO SD3 GSCs survived significantly longer than mice with transplants of control GSCs: n = 6 mice per cohort; median survival 74.5 days vs. 49.5 days; *P = 0.014, Log-rank test.

