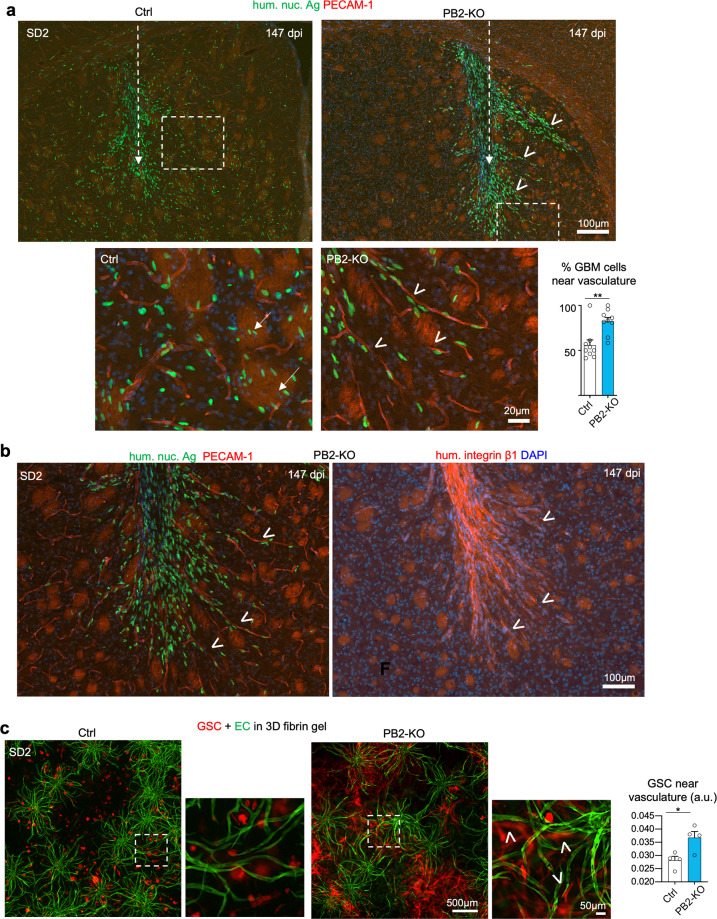
Fig. 3. Plexin-B2 deletion shifts preferred migratory path from axon tracts to the microvasculature.
a Representative IF images of coronal sections of brains with SD2 transplants at 147 dpi (dashed arrows indicate injection tract). While tumor cells (hum. nuc. Ag+) in the control cohort had invaded diffusely in the striatum as individual cells, they were largely confined to the transplant site in the PB2-KO cohort, revealing increased aggregation and collective invasion into neighboring brain tissue in bundles (arrowheads). Bottom, enlarged images of boxed areas show that invading GBM cells in control transplant displayed a predilection for striatal fiber tracts (arrows), while PB2-KO cells shifted their preference to perivascular invasion (arrowheads). Note that the nuclear orientation of the migrating PB2-KO cells is closely aligned with vascular axes (PECAM-1+). The bar graph shows quantification of the invading tumor cells along vasculature, defined as cells that are one or less than one cell diameter apart from the vessel. n = 9 areas from three independent transplants; unpaired t test; **P < 0.01. b IF images of adjacent brain sections near striatum from mice transplanted with PB2-KO SD3 GSCs at 147 dpi. Left image: at the invasion front, mutant GBM cells showed a clear preference for perivascular invasion (PECAM-1) with nuclear orientation aligned with the vessel axis (arrowheads). Right image: IF for human-specific integrin β1 shows collective chain migration of PB2-KO cells in bundles (arrowheads) that clearly avoided striatal fiber tracts, visible by background fluorescence signals. Note that migrating GBM cells closely adhere to blood vessels at the invasion front (compare images in the left and right panels). c Images from 3D vascular network cultures (containing human brain microvascular endothelial cells (GFP+), pericytes, and astrocytes) that were seeded with control or PB2-KO SD2 GSCs expressing mCherry. Photos were taken 14 days after cell seeding. PB2-KO cells displayed a bias toward vascular adherence (arrowheads). Quantification on the right indicates the relative abundance of tumor cells that were in close proximity to the vasculature (0–20 µm distance). n = 4 independent experiments per group. unpaired t test; *P < 0.05.

