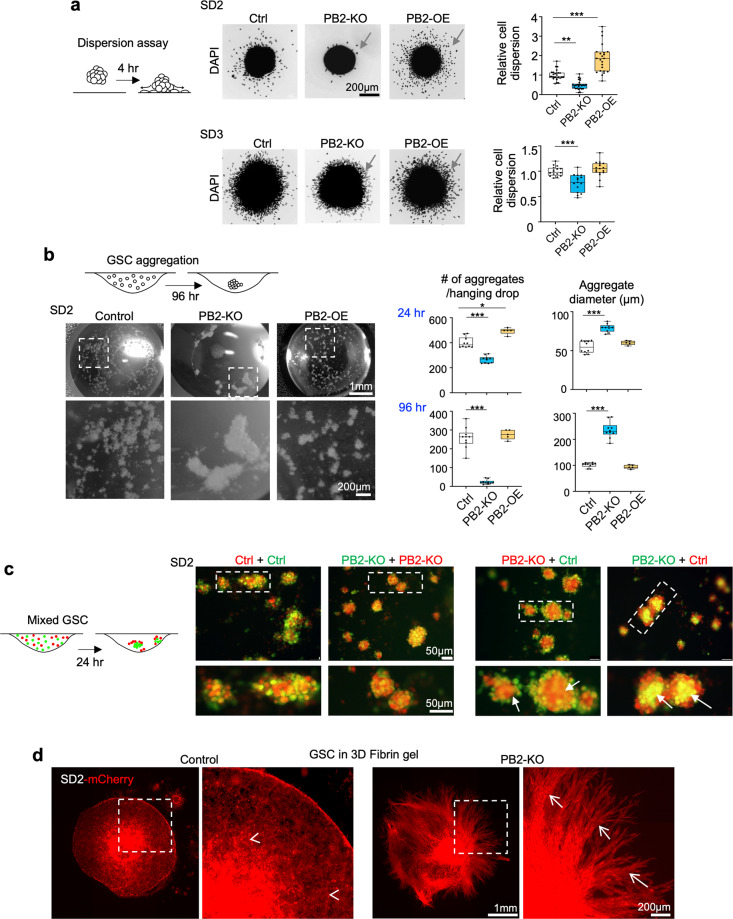
Fig. 4. Plexin-B2 lowers cell adhesiveness in GSCs.
a Left, diagram of cell dispersion assay with 3D aggregates plated on the laminin-coated surface and analyzed after 4 h for dispersion of cell from aggregates. Center, micrographs of DAPI stained aggregates and surrounding dispersed cells (arrows). Right, quantifications of cell dispersion, normalized to mean of the control condition. Box plots and whiskers indicate quartiles, center lines indicate median. n = 18–34 spheres per group; one-way ANOVA with Dunnett’s multiple comparison test of each group against control; *P < 0.05, **P < 0.01, ***P < 0.001. b Diagram illustrates the hanging drop cell aggregation assay. Photos of drops show aggregates formed by SD2 GSCs with the indicated Plexin-B2 manipulation, 96 h after seeding. Right, quantifications of aggregate numbers and sizes at 24 and 96 h. n = 5–11 hanging drops per group; one-way ANOVA with Dunnett’s multiple comparison test of each group against control; *P < 0.05, ***P < 0.001. c Left, diagram of differential hanging drop cell aggregation assay with GSCs of different genotypes labeled with green or red CellTracker dyes, and mixed 1:1 before seeding. Right, fluorescence images of SD2 aggregates after 24 h, revealing that PB2-KO cells congregated in the center (arrows), while control cells were mainly at the periphery, illustrating stronger adhesiveness between PB2-KO cells. The mixture of GSCs with identical genotypes (Ctrl + Ctrl, or KO + KO) leads to evenly distributed aggregates. d Fluorescence images of SD2 GSCs expressing mCherry that had been embedded as aggregates in 3D fibrin gel matrix. Note the striking differences in the growth/invasion patterns after 27 days: control cells invaded diffusively as individual cells (arrowheads), whereas PB2-KO GSCs invaded the surrounding matrix collectively as fasciculated migration streams (arrows).

