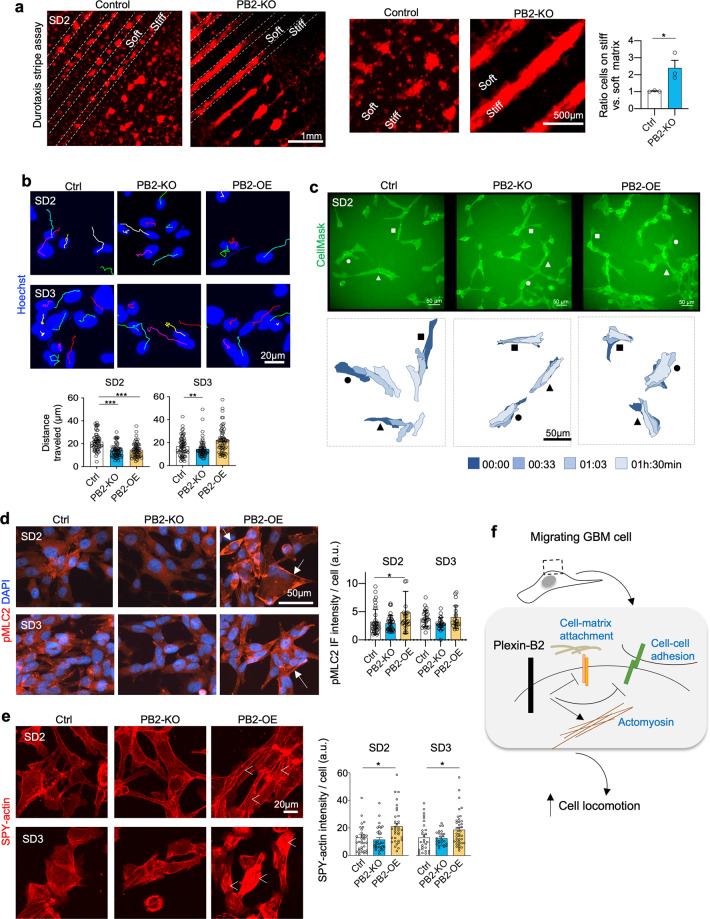
Fig. 5. Plexin-B2 counters durotaxis and enhances cell locomotion and actomyosin network.
a Durotaxis stripe assay. SD2 GSCs expressing mCherry were cultured for 10 days on alternating stripes of soft (~25 kPa) vs. stiff (~30 kPa) PEG substrates. While control GSCs spread on both soft and stiff stripes, PB2-KO cells aggregated only on stiffer stripes. Enlarged images are shown on the right. Quantification measures mCherry fluorescence signals from soft vs. stiff stripes. n = 3 independent experiments per group. *P < 0.05, unpaired t test. b Still frames captured from time-lapse live imaging of GSCs, tracked with Hoechst nuclear dye (colored lines track individual nuclei). Quantifications reveal reduced migration distance over 90 min for PB2-KO GSCs as compared to controls (see Supplementary Videos). SD2 PB2-OE GSCs also had reduced speed of locomotion, but no significant change for SD3 was detected. n = 90 tracked nuclei per condition; one-way ANOVA with Dunnett’s multi-comparison test; *P < 0.05; **P < 0.01. c Top, still frames from time-lapse live imaging of the indicated SD2 GSCs labeled with CellMask membrane dye. Bottom, three selected cells in each group shown in overlapping contour plots at 30 min-intervals over 90 min. Note the dynamic movement of control cells as compared to both PB2-KO and -OE conditions (see supplementary videos). d IF images show increased levels of phospho-myosin light chain 2 (pMLC2, arrows) in PB2-OE SD2 GSCs as compared to control cells. Right, quantifications show increased levels of IF intensity for pMLC2 per cell (corrected total fluorescence quantification; a.u., arbitrary unit). n > 30 cells for each condition. One-way ANOVA with Dunnett’s multi-comparison test; *P < 0.05. Differences for SD3 GSC did not reach statistical significance. e Live-cell imaging of GSCs stained with F-actin dye SPY-actin. Overexpression of PB2 in SD2 and SD3 GSCs leads to increased actin filament formation (arrowheads). Quantification indicates corrected total cell fluorescence; a.u., arbitrary unit. n > 30 cells for each condition. One-way ANOVA with Dunnett’s multi-comparison test; *P < 0.05. f Working model. Plexin-B2 controls actomyosin dynamics and interactions of invading GBM cells with neighboring cells and matrix substrates along migratory paths.

