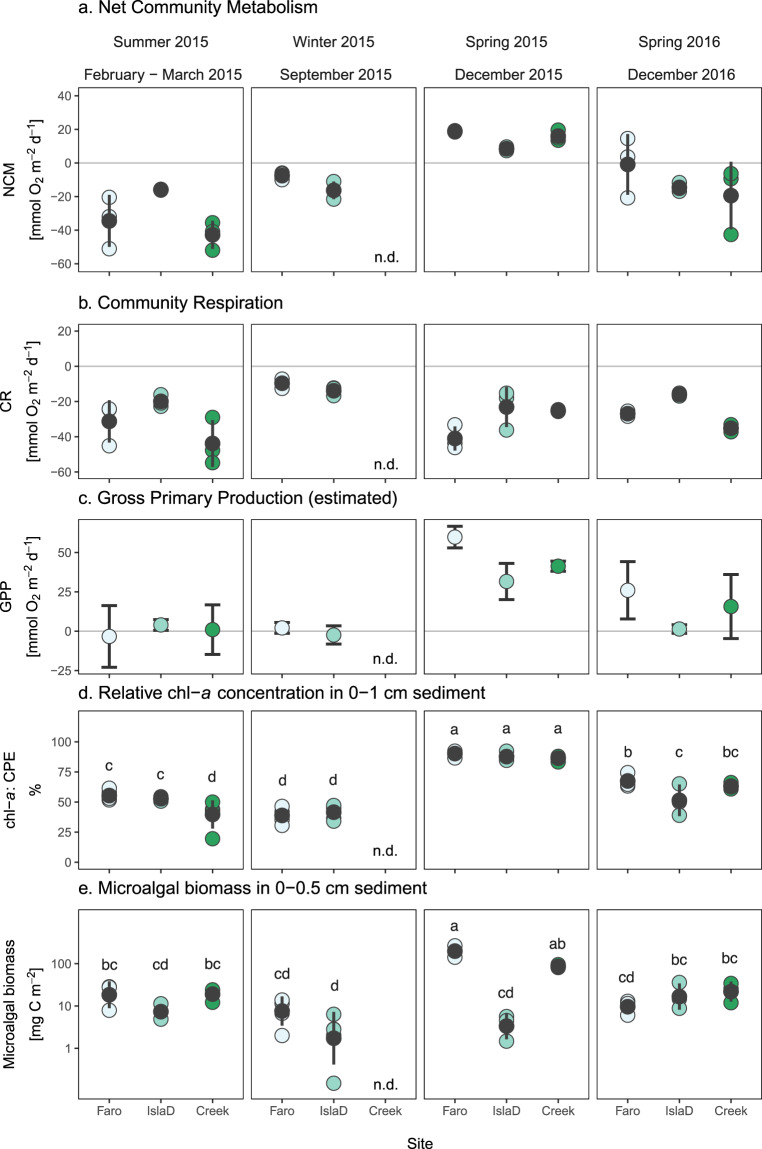
Fig. 3. Benthic metabolism parameters.
Temporal variability in benthic parameters in the three investigated sites in terms of a Net community metabolism (NCM) measured in the transparent chambers (n = 3, but see three omissions in the section “Methods”), b community respiration (CR) measured in the dark chambers (n = 3, but see two omissions in the section “Methods”) and c calculated gross primary production (GPP) based on NCM and CR (see the section “Methods”), d chlorophyll-a as a percentage of total chloroplastic pigment equivalents (CPE) in the upper 1 cm sediment (n = 5–6 in summer and winter 2015 and n = 3 in spring 2015 and 2016) and e benthic microalgal biomass in the upper 0.5 cm sediment (on log10 scale; n = 3, except for winter 2015 samples, where n = 5) in the three investigated sites. Individual measurements are shown as coloured points, while average ± s.d. is shown in black. Letters in d and e refer to statistical differences that are specified in Supplementary Table 2. Source data can be found in Supplementary Dataset 2.

