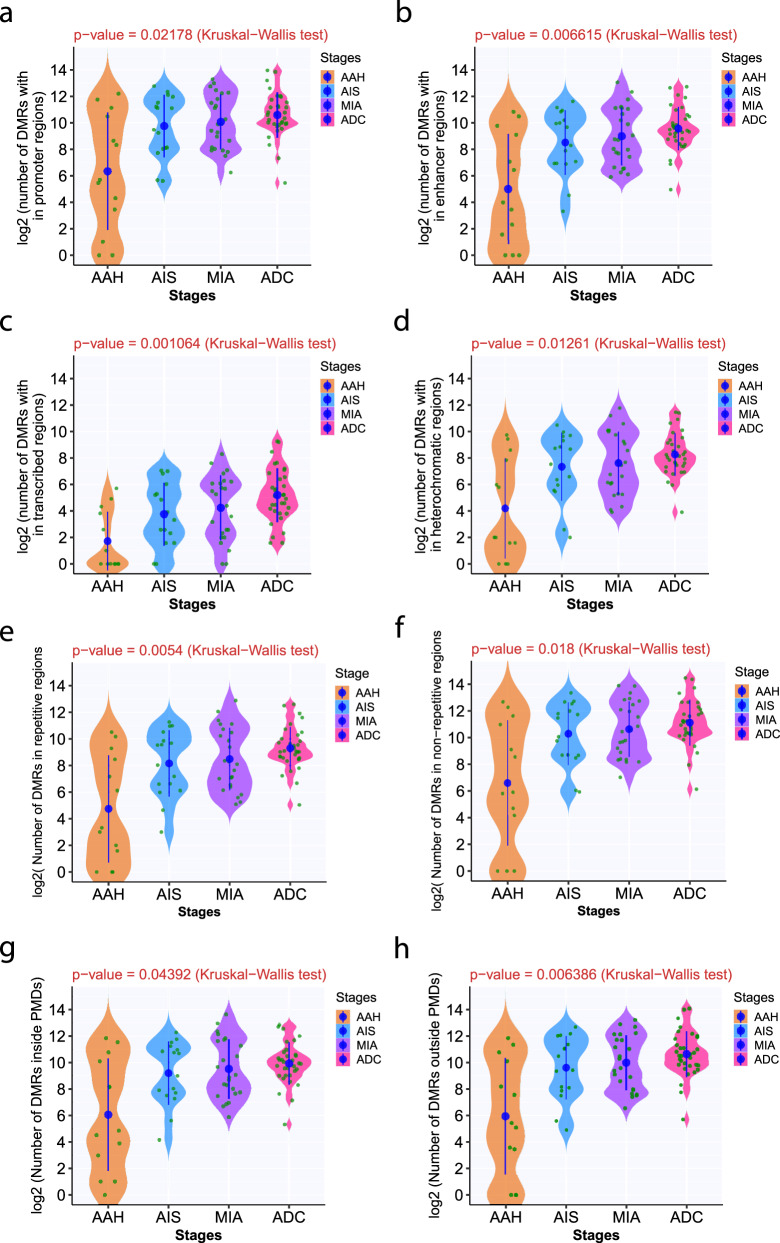
Fig. 2. The number of DMRs in IPNs of different stages by genomic regulatory regions and PMDs.
The number of DMRs are shown in promoters (a), enhancers (b), transcribed regions (c), repressed regions (heterochromatin) (d), repetitive regions (e), non-repetitive regions (f), inside PMDs (g), and outside PMDs (h). The solid blue dots represent the means of normalized numbers of DMRs in IPNs of each histologic stage with a 95% confidence interval as error bars. The differences among all stages were assessed using the Kruskal-Wallis H test. Source data is provided as a source data file.

