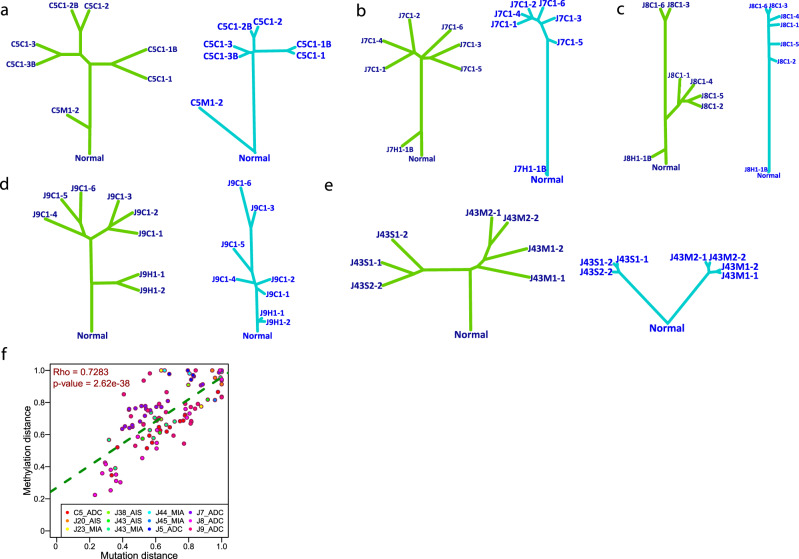
Fig. 5. The evolutionary relationship between genomic and methylation landscape.
Phylogenetic trees based on mutations (blue) and methylation values (green) in patient C5 (a), J7 (b), J8 (c), J9 (d), and J43 (e). The length of each branch indicates the similarity of mutation or methylation profiles between any pair of two spatially separated specimens from each patient. To avoid overfitting, only patients with IPNs having a minimum of four spatially separated specimens were included for this analysis. f Correlation of genetic distance (Hamming distance based on all mutations) and methylation distance (Euclidean distance based on methylation values of all CpG sites) between different spatially separated specimens from the same IPNs assessed by two-tailed Spearman’s correlation analysis (p = 2.62 × 10−38). Each dot represents the normalized distance between each pair of specimens from the same IPNs. Source data is provided as a source data file.

