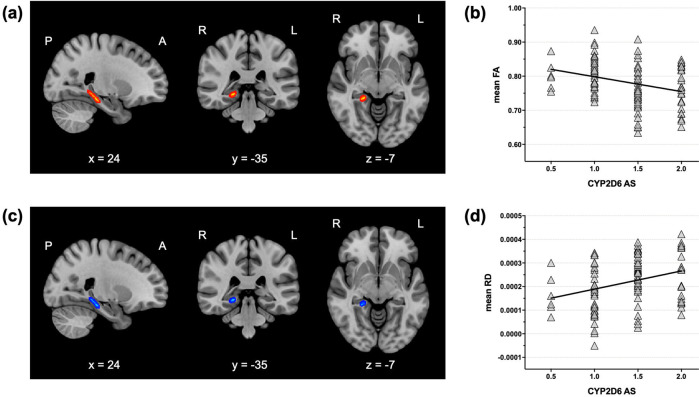
Fig. 2. Comparison of hippocampal white matter connectivity between IM and EM patients with schizophrenia.
The IM group showed significantly increased FAs (a) and decreased RDs (c) compared to the EM group in the right hippocampal white matter region (TFCE-corrected p < 0.05). The mean FAs (b) and RDs (d) in this region were significantly correlated with the activity score of CYP2D6 in participants with schizophrenia. IM intermediate metabolizer, EM extensive metabolizer, FA fractional anisotropy, RD radial diffusivity, TFCE threshold-free cluster enhancement.

