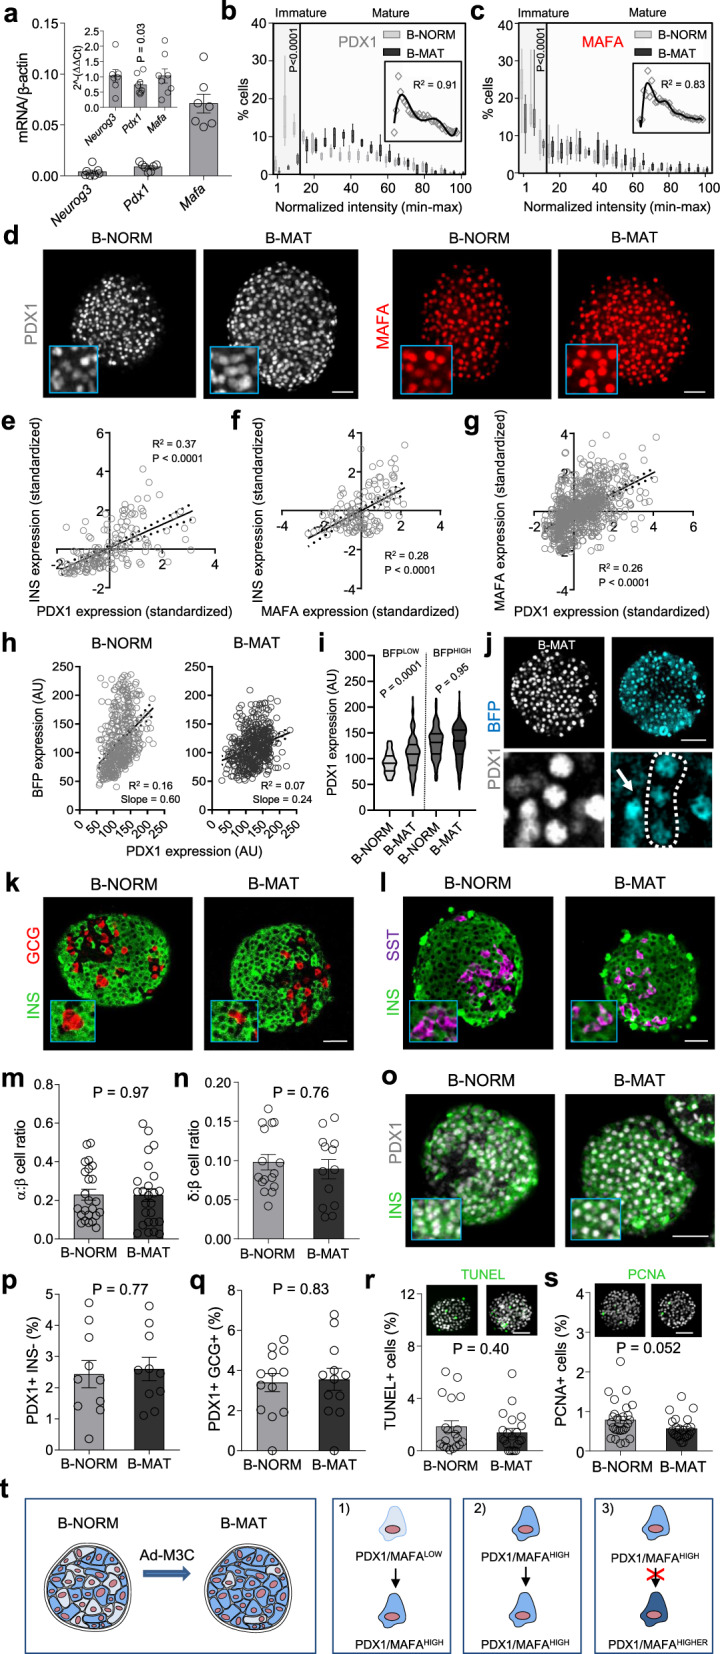
Fig. 1. Generating islets with proportionally more PDX1HIGH/MAFAHIGH β-cells.

a Adenoviral Neurog3, Pdx1 and Mafa in islets (inset, endogenous gene expression) (n = 5 animals; paired t-test). b Islets transduced with Ad-M3C (β-cell mature; B-MAT) lose β-cells occupying the bottom 15 percentile for PDX1 compared to controls (β-cell normal; B-NORM) (inset, non-normalized polynomial-fitted B-NORM distribution) (n = 6 islets/3 animals; two-way ANOVA, Bonferonni’s multiple comparison) (F = 18.75, DF = 20). c As for b, but showing the frequency distribution for MAFA (n = 8 islets/3 animals; two-way ANOVA, Bonferonni’s multiple comparison) (F = 3.03, DF = 20). d Images showing more homogenous PDX1/MAFA fluorescence in B-MAT islets (scale bar = 60 µm). e–g INS-PDX1 (e), INS-MAFA (f) and MAFA-PDX1 (g) are positively correlated (n = 137 cells, linear regression). h The linear correlation between PDX1 and BFP in Pdx1-BFP islets is lost following Ad-M3C transduction (B-MAT) (n = 465 cells/3 animals). i BFPLOW cells (prior immature) become PDX1HIGH in B-MAT islets, while BFPHIGH cells (prior mature) remain PDX1HIGH (n = 93 cells/3 animals; one-way ANOVA with Sidak’s multiple comparison) (F = 52.12, DF = 3). j Images from Pdx1-BFP islets showing cells that underwent PDX1LOW - > PDX1HIGH conversion (arrow shows a cell that remained PDX1HIGH) (scale bar = 50 µm) (n = 5 islets/3 animals; two-way ANOVA, Bonferroni’s multiple comparison) (F = 2.80, DF = 18). k–q No differences are detected in the ratios of α- to β-cells (n = 23 islets/3 animals) and δ- to β-cells (n = 18 islets/3 animals) (k–n), or the proportion of PDX1 + /INS− or PDX1 + /GLU + cells (n = 10 islets/4 animals) (o–q) in B-MAT islets (unpaired t-test) (scale bar = 40 µm). r No difference in TUNEL+ cell numbers is detected in B-MAT islets (n = 18 islets/4 animals; unpaired t-test) (scale bar = 42.5 µm). s Cell proliferation is similar in B-NORM and B-MAT islets, as shown by PCNA staining (n = 24 islets/4 animals; unpaired t-test) (scale bar = 42.5 µm). t Transition to high PDX1/MAFA content occurs in PDX1LOW/MAFALOW cells (1), whereas PDX1HIGH/MAFAHIGH cells remain unaffected (2), with PDX1/MAFA levels never surpassing those in B-NORM islets (3). Bar graphs show the mean ± SEM. Violin plot shows median and interquartile range. Box-and-whiskers plot shows median and min-max. All tests are two-sided where relevant. BFP-blue fluorescent protein; INS-insulin; GLU-glucagon; SST-somatostatin; TUNEL-terminal deoxynucleotidyl transferase dUTP nick-end labeling; PCNA-proliferating cell nuclear antigen.
