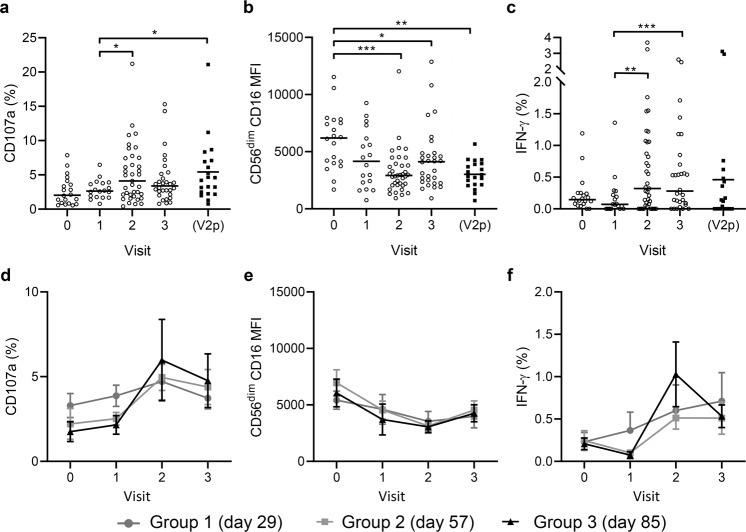
Fig. 4. Antibody-dependent responses of NK cells from individual trial participants using their autologous pre-vaccination and post-vaccination sera.
PBMCs collected pre-vaccination (visit 0), post-dose 1 (visit 1), 14 days post-dose 2 (visit 2), and 180 days post-dose 2 (visit 3) were cultured with EBOV GP in the presence of autologous serum from the same visit (or pooled visit 2 serum; V2p) and analysed by flow cytometry for CD107a (a, d), CD16 MFI (b, e), and IFN-γ (c, f) expression. Pooled data from all three vaccine groups (see Table 1 for number of participants), data points are shown with a line representing median values (a–c). Data according to individual vaccination groups are shown with mean values and s.e.m. Comparisons between visit was performed using one-way ANOVA mixed effects analysis with Geisser–Greenhouse correction. *p < 0.05, **p < 0.01, ***p < 0.001.

