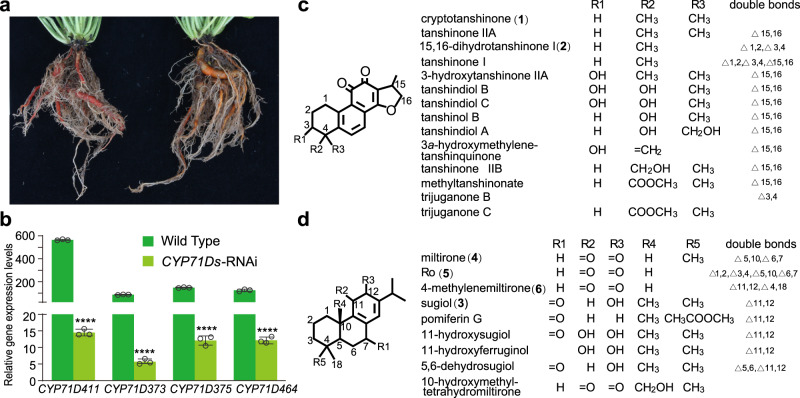
Fig. 4. Phenotype, expression and metabolite profile changes of CYP71Ds-RNAi plants.
a Coloration of roots from WT (left) and CYP71Ds-RNAi knockdown (right) plants. b Relative mRNA levels of the four CYP71D genes in CYP71Ds-RNAi and wild-type plants from transcriptome data. Error bars represent standard deviation SD (n = 3 biologically independent samples; ****P < 0.0001 by 2-sided Student’s t test). c Down-regulated tanshinone related diterpenoids in roots of CYP71Ds-RNAi relative to WT plants. d Up-regulated tanshinone related diterpenoids in roots of CYP71Ds-RNAi relative to WT plants. Source data underlying Fig. 4b are provided as a Source Data file.

