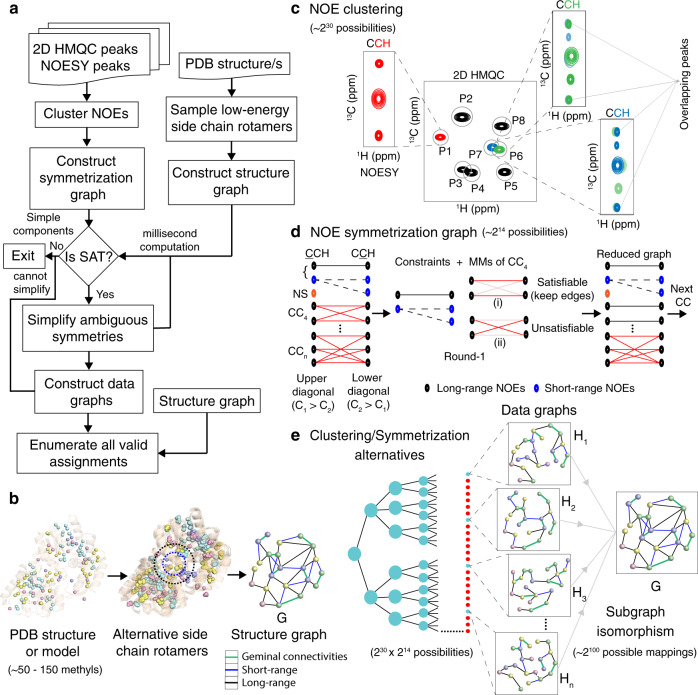
Fig. 1. Exhaustive enumeration of methyl assignments from raw NOE peaks.
a Iterative workflow of the MAUS system. b Description of a structure graph, G with (~50–150) methyls as nodes. The edges of G correspond to all possible short-range (blue; up to 6–8 Å), long-range (black; from 6 up to 10 Å), and geminal methyl connectivities (green). c The 2D projections of 3D or 4D NOESY peaks are clustered (within tolerances; gray circles) to 2D HMQC reference peak positions (P1…P8). A NOESY peak can be clustered uniquely (red) or ambiguously (green and blue; overlapping peaks), leading to ~230 clustering combinations for typical 3D CM-CMHM NOESY data. d The observed chemical shift coordinates (C1,C2,H2) of all NOE peaks are used to construct a symmetrization graph, S, with partitions representing upper (C1 > C2) and lower (C2 > C1) diagonal cross-peaks. S has nodes represented by short-range (blue) and long-range (black) NOEs, and edges connecting potentially symmetric NOE peaks. S has components of sizes 1 (no symmetry or NS), 2 and 3 (simple), and >3 (complex, CC), producing ~214 possibilities in the case of data recorded for maltose-binding protein, MBP. Simple components are used as constraints whereas complex components are reduced using an iterative process within MAUS: the maximum matchings (MMs) of each complex component are tested for satisfiability; satisfiable edges are retained in S. e A N-ary tree showing data graphs (H1,H2,H3,…,Hn) generated from all clustering and symmetrization alternatives (~244 possibilities); a majority of these data graphs do not lead to satisfying assignments and are eliminated by MAUS (red circles). Each remaining H can be mapped in ~2100 possible ways onto G; all valid methyl resonance assignments are enumerated and presented to the user in a compact form.

