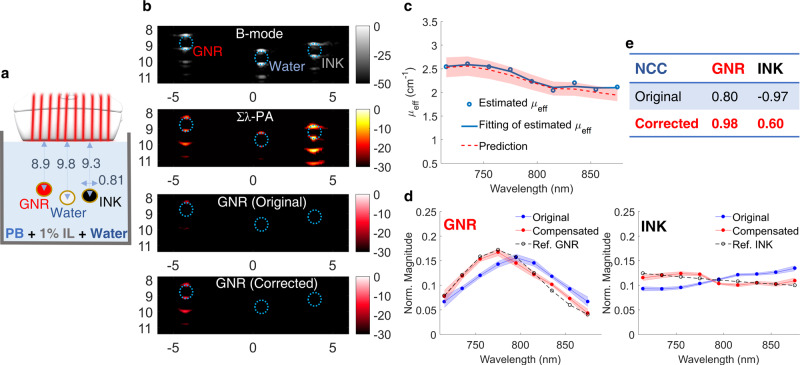
Fig. 3. Phantom spectroscopic PA imaging with optical fluence compensation.
GNR (gold nanorods), de-ionized water, and black ink were injected into three different tubes immersed in an absorbing and highly scattering background (1% Intralipid suspension mixed with Prussian blue nanoparticles). a Experimental setup. b First row: B-mode image. Second row: wavelength-compounded, Σλ-PA, image. Third/Fourth row: GNR-weighted PA image without/with optical fluence compensation. The horizontal and vertical axes represent lateral and axial dimensions in units of mm, respectively. Wavelength-dependent fluence was estimated using PA signals at the top of the tube filled with black ink. c The estimated effective optical attenuation coefficient (μeff, blue line) is compared to predictions using the UV–VIS measured absorption coefficient of Prussian blue aqueous solution and the reduced scattering coefficient of Intralipid known from the literature58 (red shaded region). d Measured spectra (normalized to the area under the spectrum) of GNR (left) and black ink (right) are expressed as mean ± standard deviation. For each panel, the spectrum after fluence compensation (red solid line) is compared to the uncompensated spectrum (blue line) and the reference UV–VIS result (dashed line). e Improvements after fluence compensation for GNR and black ink solutions are quantified in terms of the averaged normalized correlation coefficient (NCC).

