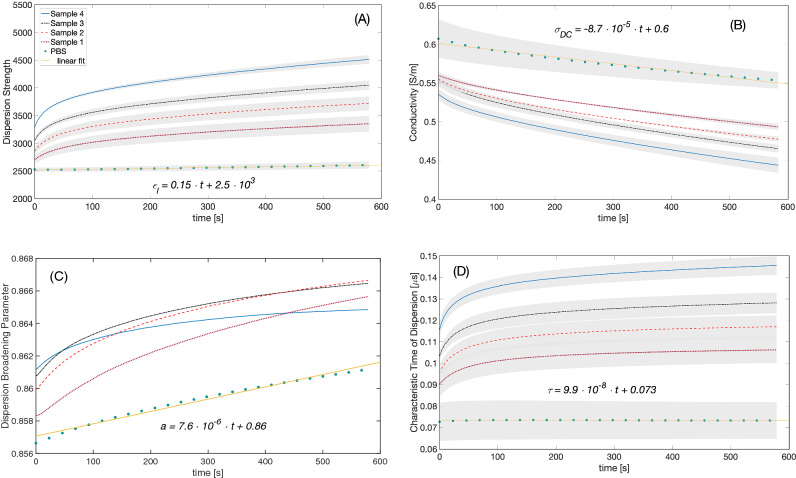
Figure 2.
Dispersion strength () (a), conductivity () (b), dispersion broadening parameter () (c), and dielectric relaxation time constant () (d) of the blood samples. Different color lines correspond to different samples. Mean data from experiments with hematocrit values 42%, 43%, and 47% are shown. The shaded area around each curve represents the standard error. The standard error is not shown for the dispersion broadening parameter for clarity. The inset equations are linear fits to PBS data.

