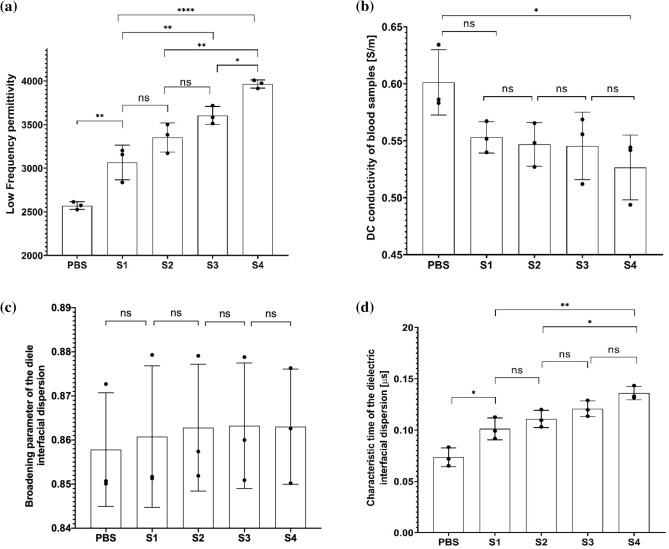
Figure 4.
Comparison of low frequency permittivity () (a), conductivity () (b), dispersion broadening parameter () (c), and dielectric relaxation time constant () (d) of the experimental data from measurements with blood samples of varying HES concentration. The displayed data is for time point . Results are shown using box plots. One-way ANOVA with Tukey’s post-hoc test is used for multiple comparison. Probability values are indicated on figures by asterisks, as follows: *p < 0.05; **p < 0.01, ***p < 0.001, ****p < 0.0001.

