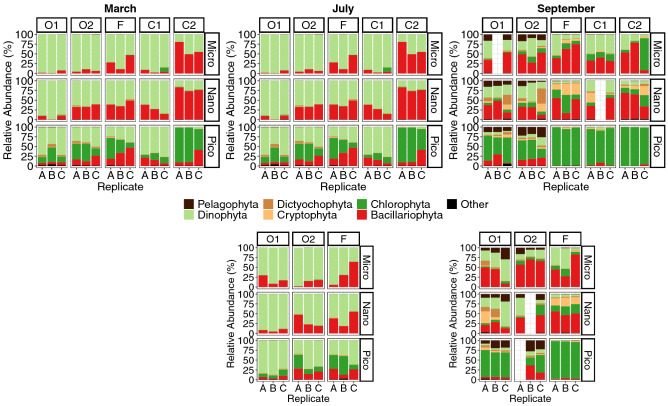
Figure 2.
Proportions of eukaryotic phytoplankton taxa estimated by DNA-barcoding in the Iroise Sea in March, July and September 2015. Samples are organized by replicates, size-fractions, sampling stations, depths (surface and Deep Chlorophyll Maxima, DCM) and seasons. The relative abundance was calculated based on the number of reads of the OTUs corresponding to the shown phytoplankton taxa, ‘Other’ represents the proportion of taxa with a relative abundance < 10% over the dataset.

