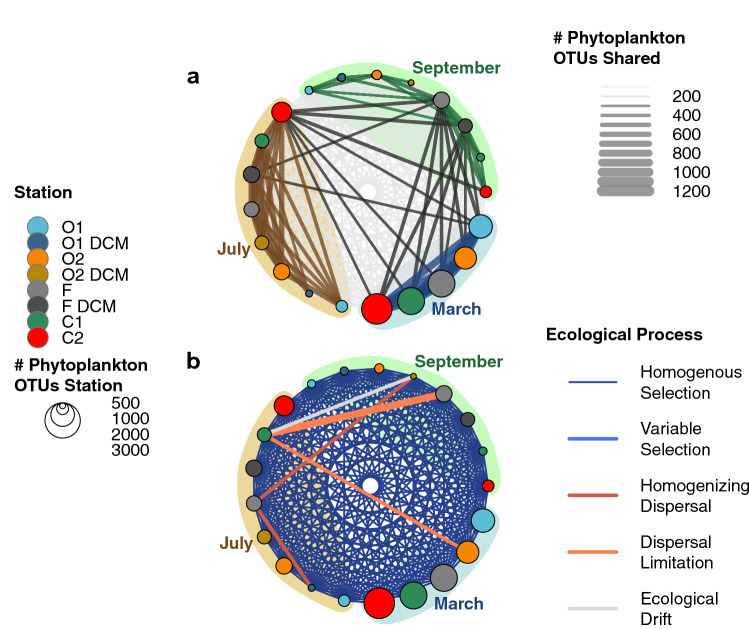
Figure 4.
Spatiotemporal patterns of diversity and the dominant ecological processes driving eukaryotic phytoplankton communities sampled in the Iroise Sea in March, July and September 2015 across our 5 stations and depth (at surface and DCM). (a) OTU-connectivity network, the node size represents the number of OTUs in each station (see node color) and each season; the edge width represents the number of OTUs shared between stations; the edge color represents: low connectivity (light grey in the background, < 300 OTUs shared), intra-seasonal connectivity (colored) and cross-seasonal connectivity (black). (b) Dominant ecological processes explaining the pairwise differences between phytoplankton communities sampled in the Iroise Sea, the edge color represent the dominant ecological processes between the communities of each station as estimated in the approach of reference55. On the figure, we put emphasis on processes different from Homogenous Selection, the process dominating 5541 out of the 5551 pairwise community comparisons in our dataset. The edge width linking ‘C1 in July’ and ‘F in September’ was doubled because an ecological process other than Homogenous Selection appeared more than once (across replicates of the micro-plankton). All networks were plotted using the R package “igraph”54.

