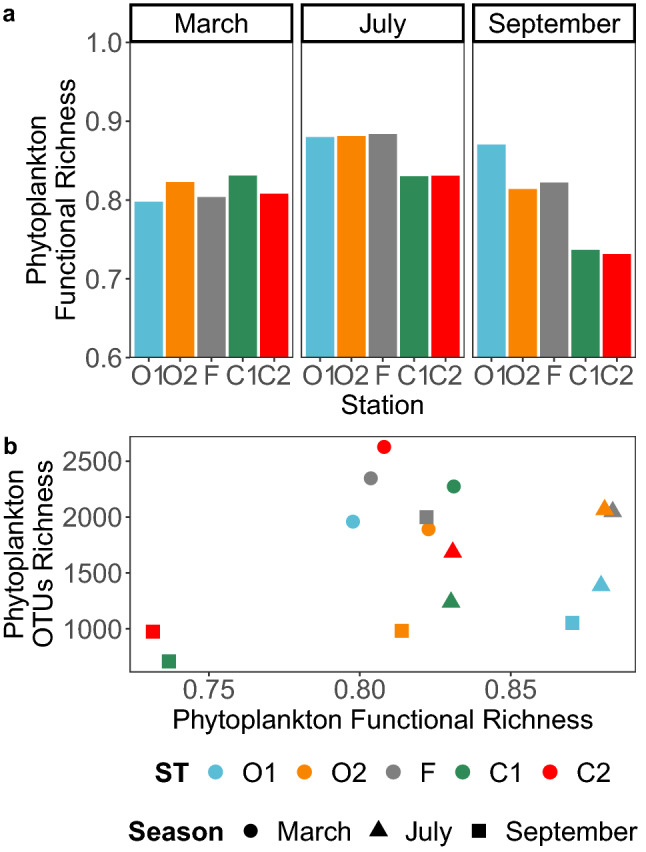
Figure 6.

Patterns of eukaryotic phytoplankton functional richness in the Iroise Sea in 2015. (a) Functional richness was computed based on the phytoplankton OTUs (7106) present in each station (3) and each season (3) that were annotated with 12 biological traits. The trait annotation was carried out during a previous literature survey43, and the metric was calculated by following reference61. (b) Pairwise comparisons of phytoplankton functional richness and taxonomic richness (OTUs) in our dataset.
