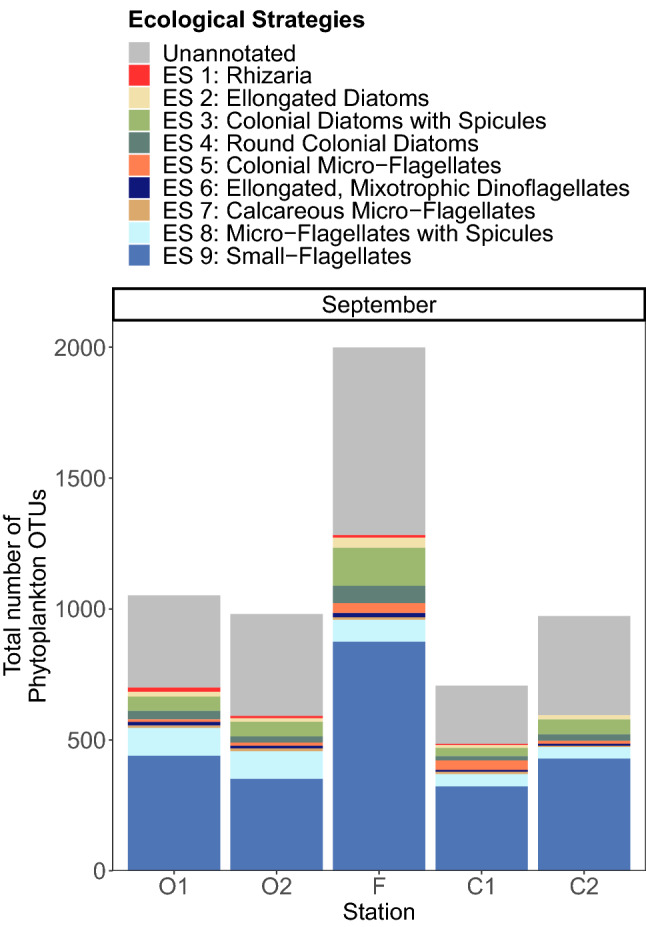
Figure 7.

Phytoplankton richness within 9 ecological strategies of phytoplankton displayed across five sampling stations of the Iroise Sea in September 2015. Phytoplankton OTUs were sorted into distinct ecological strategies (see legend) represented by trait combinations (conserved within the groups) and when possible annotated with taxonomic affiliations. The gray area of the barplots represents the richness of the OTUs that could not be annotated with traits or with an ecological strategy.
