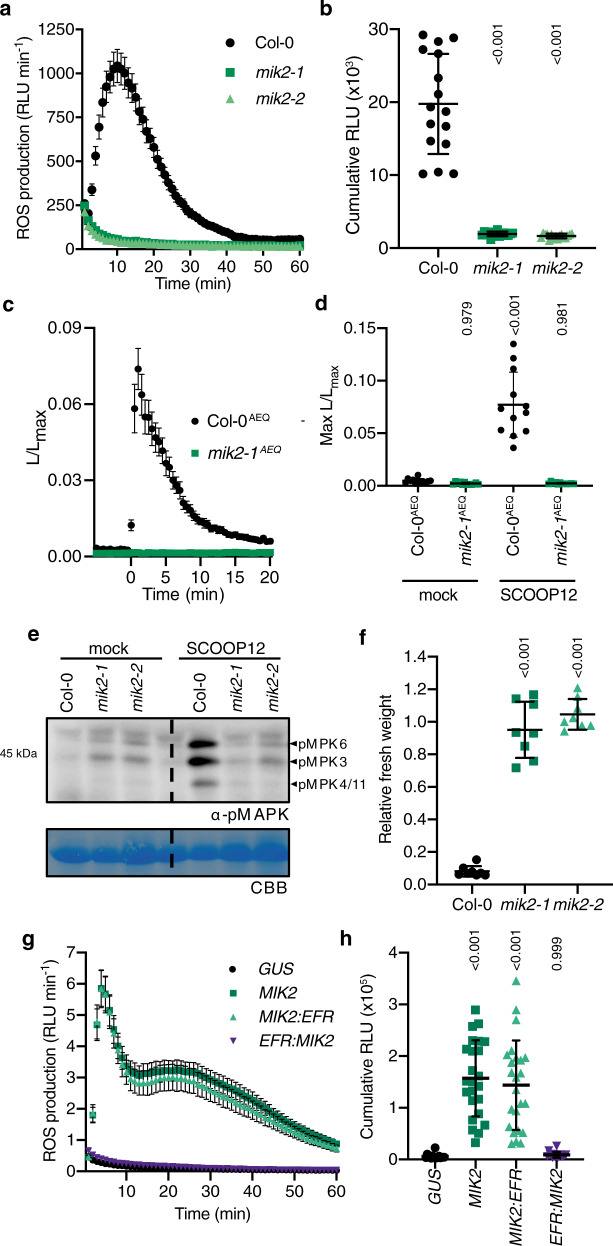
Fig. 1. MIK2 is required and sufficient for SCOOP12-induced responses.
a, b ROS production in leaf disks collected from 4-week-old A. thaliana plants induced by 1 μM SCOOP12 application (n = 16 leaf disks). a Points represent mean; error bars represent S.E.M. b Integrated ROS production over 40 min. Line represents mean; error bars represent S.D. c, d The mik2-1 mutation was crossed into the pUBQ10::AEQUORIN background, and calcium levels were measured in seedlings relative to maximum upon discharge following the addition of 100 nM SCOOP12 (n = 12 seedlings). c Points represent mean; error bars represent S.E.M. d Maximum relative SCOOP12-induced calcium levels ±S.D. e Western blot using α-p42/p44-ERK recognizing phosphorylated MPK6, MPK3, and MPK4/11 in seedlings treated with 100 nM SCOOP12 or mock for 15 min. Membranes were stained with CBB, as a loading control. f Fresh weight of 14-day-old seedlings grown in the presence of 1 μM SCOOP12 for 10 days relative to mock (n = 8 seedlings). A line represents mean; error bars represent S.D. g, h) ROS production in leaf disks of N. benthamiana transiently expressing the defined constructs induced by 1 μM SCOOP12 application (n = 24 leaf disks). g Points represent mean; error bars represent S.E.M. h Integrated ROS production over 60 min. A line represents mean; error bars represent S.D. P-values indicate significance relative to the WT control (or GUS transformed control) in a Tukey’s multiple comparisons test following one-way ANOVA. All experiments were repeated and analyzed three times with similar results. ROS reactive oxygen species, CBB Coomassie brilliant blue.

