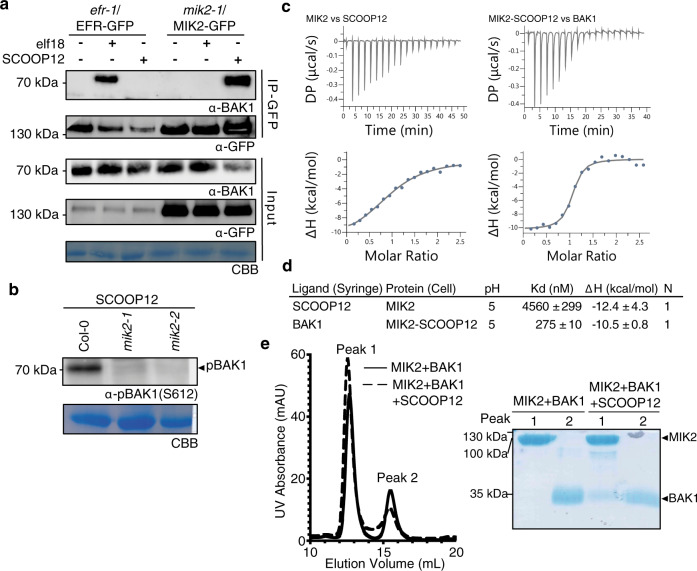
Fig. 2. SCOOP12 induces MIK2–BAK1 complex formation.
a Co-immunoprecipitation of BAK1 with MIK2–GFP from mik2-1/MIK2-GFP and EFR-GFP from efr-1/EFR-GFP seedlings treated with 1 μM elf18, 1 μM SCOOP12, or water for 10 min. Western blots were probed with antibodies α-GFP and α-BAK1. b Western blot using α-pBAK1(Ser612) of seedlings after 15 min treatment with 100 nM SCOOP12. a, b were repeated three times with similar results. c ITC experiments of MIK2 vs SCOOP12, and MIK2–SCOOP12 complex vs BAK1. Representative raw thermogram plots of ITC experiments. d ITC table summarizes of MIK2 vs SCOOP12, and MIK2–SCOOP12 vs BAK1. The binding affinities between MIK2 and SCOOP12, and MIK2–SCOOP12 and BAK1, are reported as Kd, (dissociation constant, in nanomoles). The N indicates the reaction stoichiometry (N = 1 for a 1:1 interaction). ΔH indicates the enthalpy variation. Values indicated in the table are means ± SD of independent experiments (n = 3). Corresponding ITC runs are reported in Supplementary Figure 6. e Analytical SEC (left panel) of MIK2–BAK1 complex in the presence and absence of SCOOP12. An SDS-PAGE of the peak fractions is shown alongside (right panel). ITC isothermal titration calorimetry, SEC size-exclusion chromatography.

