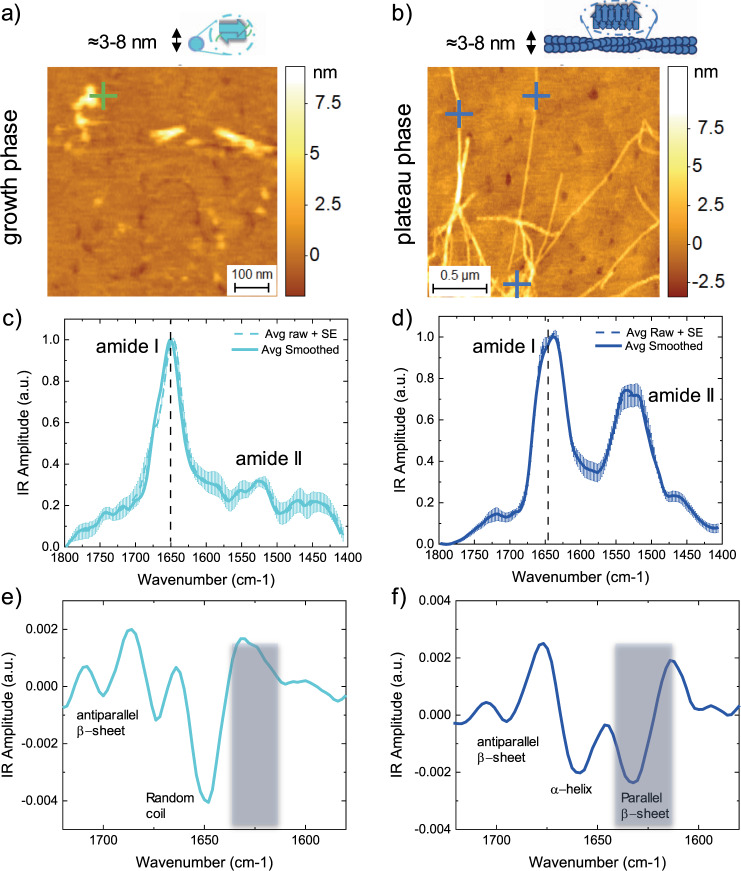
Fig. 2. Single molecule measurements of secondary and quaternary structure of Aβ42 aggregates.
a, b AFM-IR morphology maps of single oligomeric (light blue sphere) (a) and fibrillar species (dark blue rod) (b) of Aβ42. The morphology of the aggregates was reproducible and consistent on at least five independent and randomly chosen areas on the surface of each sample. c, d Nanoscale localised IR absorption spectra of oligomeric (c) and fibrillar species (d) of Aβ42. We represent two spectra: (i) the average + SE of the raw spectra and (ii) the average + SE of the preprocessed spectra by applying an adjacent averaging filter (5 pts) and a Savitzky–Golay filter (second order, 15 pts). At least five different raw spectra at each position (coloured crosses) were acquired. e, f The second derivatives of the spectra are calculated with a Savitzky–Golay filter (second order, 15 pts) to deconvolve the major secondary structural contributions of the oligomeric and fibrillar species.

