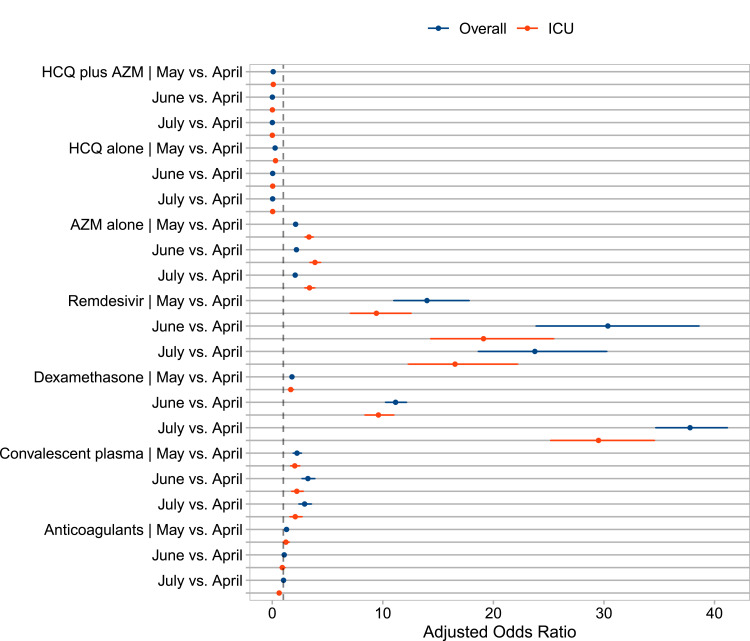
Figure 2.
Adjusted odds ratios of therapies for COVID-19 in May, June, or July compared to April in hospitalized patients in the US. Multivariable regression using generalized estimating equations (GEE) with logit link and binomial distribution function were used to examine differences in the therapies use between the admission months. Patients and provider characteristics displayed in Supplementary Table 1 were adjusted for in the GEE model. The forest plot displays adjusted odds ratios and 95% confidence intervals of therapies in May, June, and July compared to April in the overall study population and patients admitted to the ICU (see Supplementary Tables 4 and 5).

