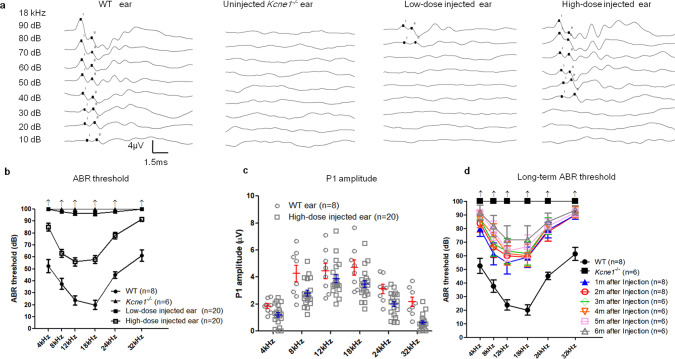
Fig. 6. Comparison of auditory brainstem response (ABR) data measured from WT, untreated, and treated Kcne1−/− mice (n ≥ 6 in each group).
a Series of representative waveforms of ABRs elicited by different intensities of tone burst (at 18 kHz) are given for WT, untreated, and low- and high-dose-treated Kcne1−/− mice (as labeled). b Averaged ABR thresholds at various frequencies for different groups of mice as indicated by the figure legends. Data are shown as mean ± SEM. Upward arrows indicate that ABR thresholds were at the maximal sound level that could be measured by our equipment. Source data are provided as a Source data file. c The peak amplitude of ABR wave 1 (P1) elicited at 90 dB SPL from 4 to 32 kHz. Source data are provided as a Source data file. d Changes in ABR thresholds of high-dose-injected Kcne1−/− ears measured at 1–6 months after injections. Data are shown as mean ± SEM. Source data are provided as a Source data file.

