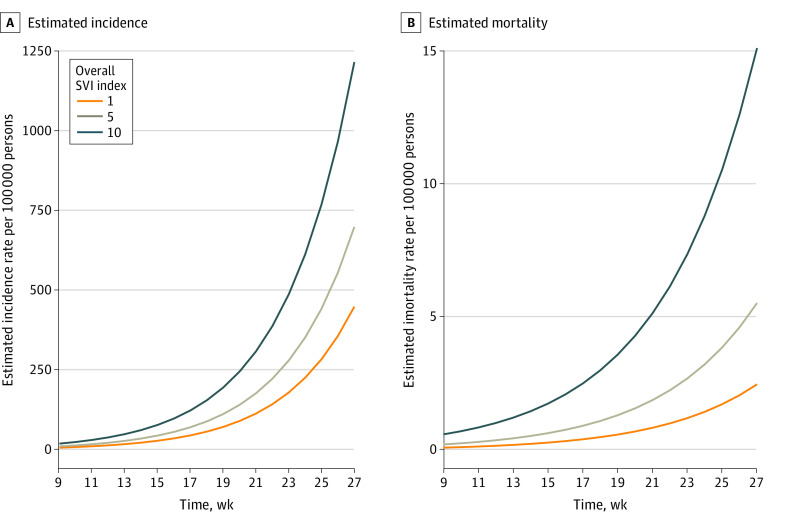
Figure 2. Association of Social Vulnerability Index (SVI) Values With Weekly Cumulative Coronavirus Disease 2019 Incidence and Mortality Rates.
Incidence and mortality are presented per 100 000 population from March 25 to July 29, 2020, in a county with a Rural-Urban Continuum Code mean of 6, defined as urban population of 2500 to 19 999, adjacent to a metropolitan area. Graphs present the estimated incidence and mortality per 100 000 with population density and state-wide COVID-19 testing rate fixed at their means, and county random effect fixed at 0. For estimated mortality, the deaths per 100 000 was fixed at the mean. Solid lines show the association between time and cumulative COVID-19 incidence and mortality. Analytic sample excluded the counties spanning New York, New York.

