
Figure 2. Correlation Between Maternal and Neonatal Cord Sera Severe Acute Respiratory Syndrome Coronavirus 2–Specific Antibody Concentrations.
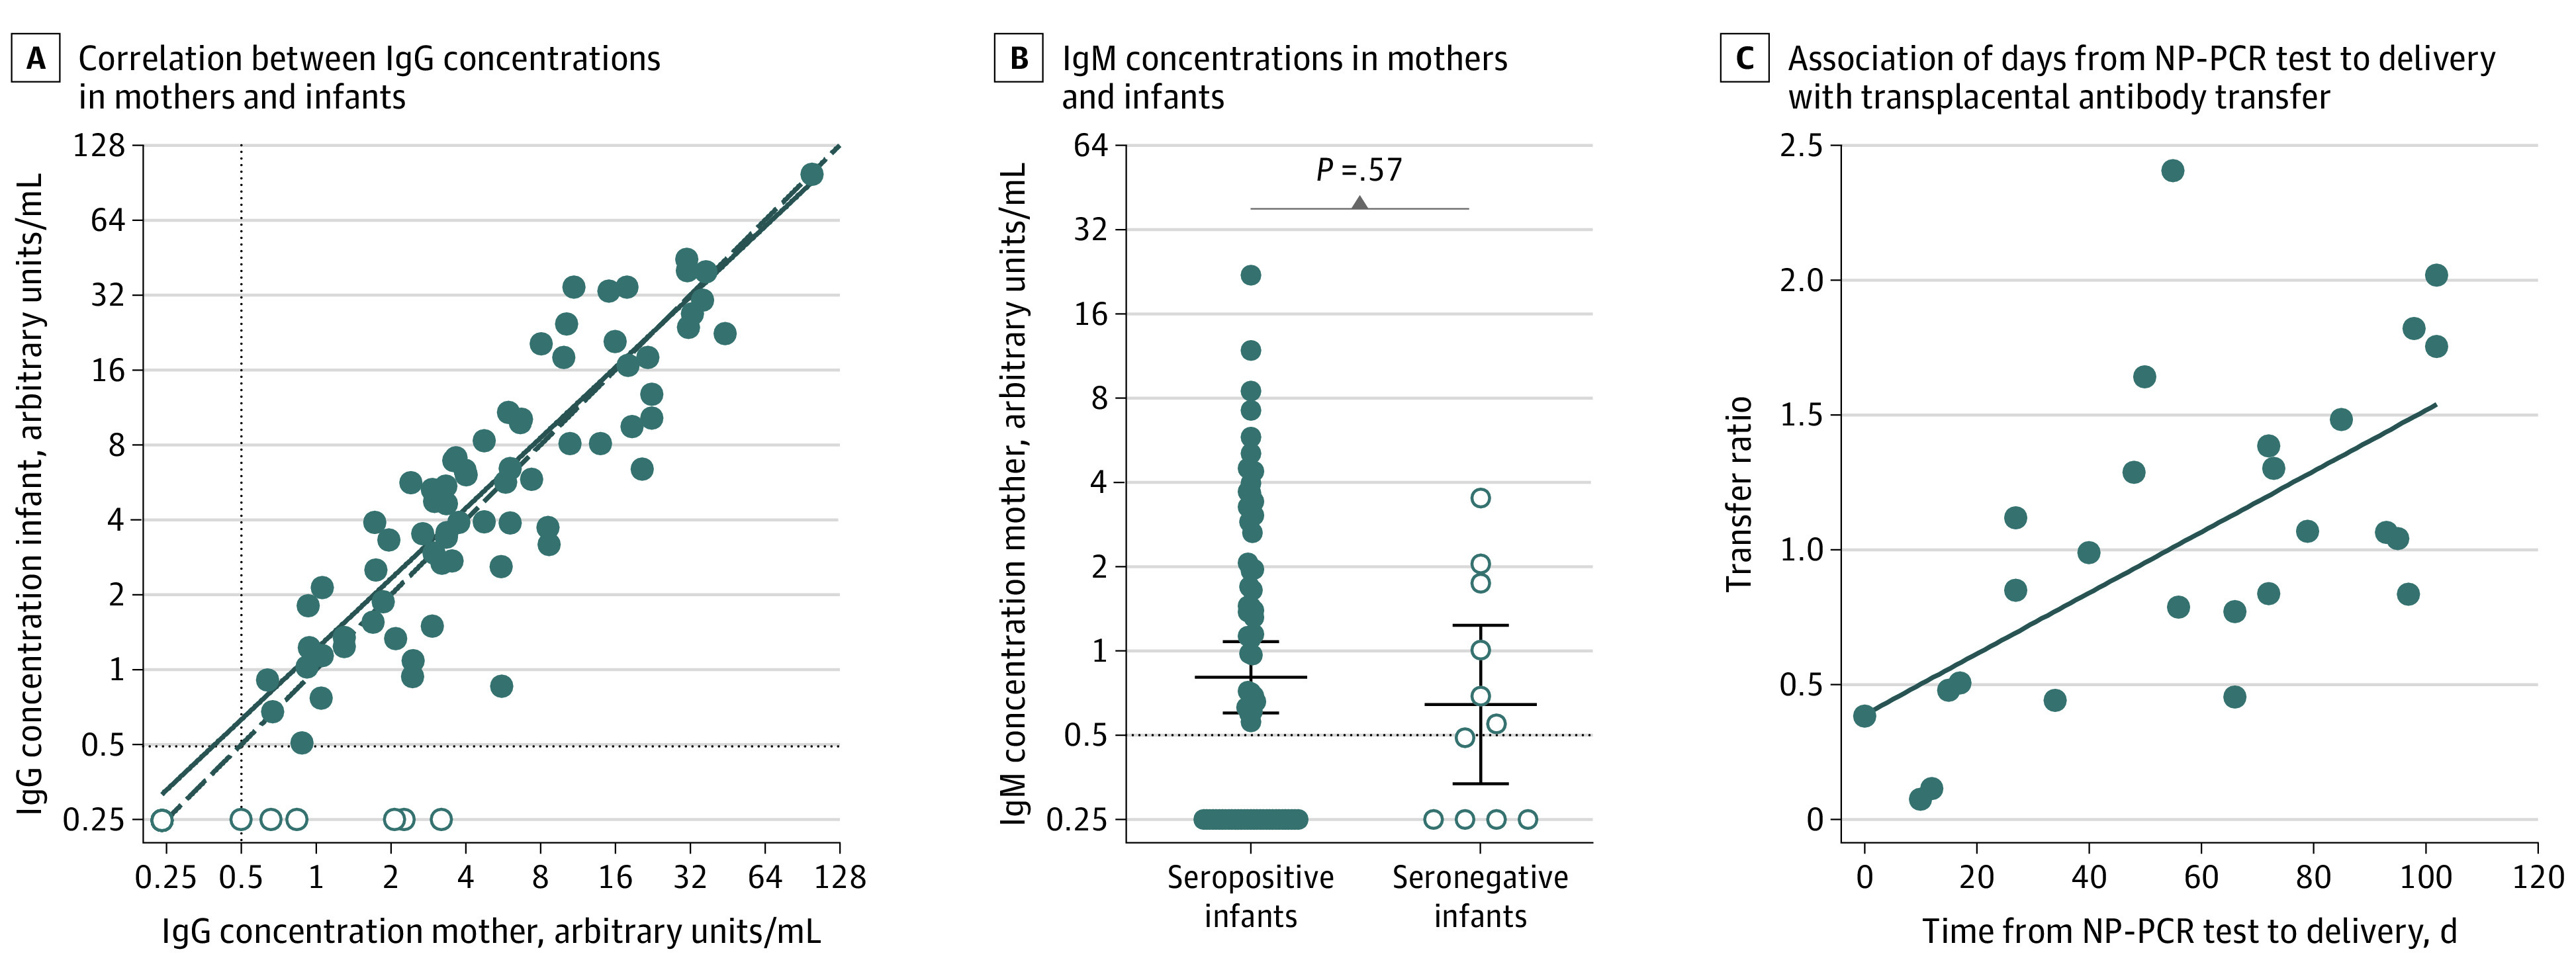
A, Correlation between IgG concentrations in sera from seropositive women and matched cord blood from seropositive (n = 72; filled circles) and seronegative (n = 11; open circles) infants. IgG concentrations in cord blood positively correlate with maternal IgG concentrations (r = 0.886; P < .001). B, IgM concentrations in sera from seropositive women with seropositive (n = 72; filled circles) and seronegative (n = 11; open circle) infants. Horizontal lines represent geometric mean titers and error bars indicate the 95% CI (P = .57 using an unpaired t test on log2-transformed IgM concentrations). In panels A and B, the horizontal dashed line indicates 0.48 arbitrary units/mL, which was the cutoff used to distinguish positive vs negative samples. Samples that were below this cutoff were assigned an antibody concentration of 0.24 arbitrary units/mL. C, Association of duration in days from nasopharyngeal polymerase chain reaction (NP-PCR) test to delivery with transplacental antibody transfer. Transfer ratio of IgG antibodies from mother to infant (n = 26 matched mother-infant dyads) is positively correlated with days from NP-PCR test to delivery (r = 0.620; P < .001).