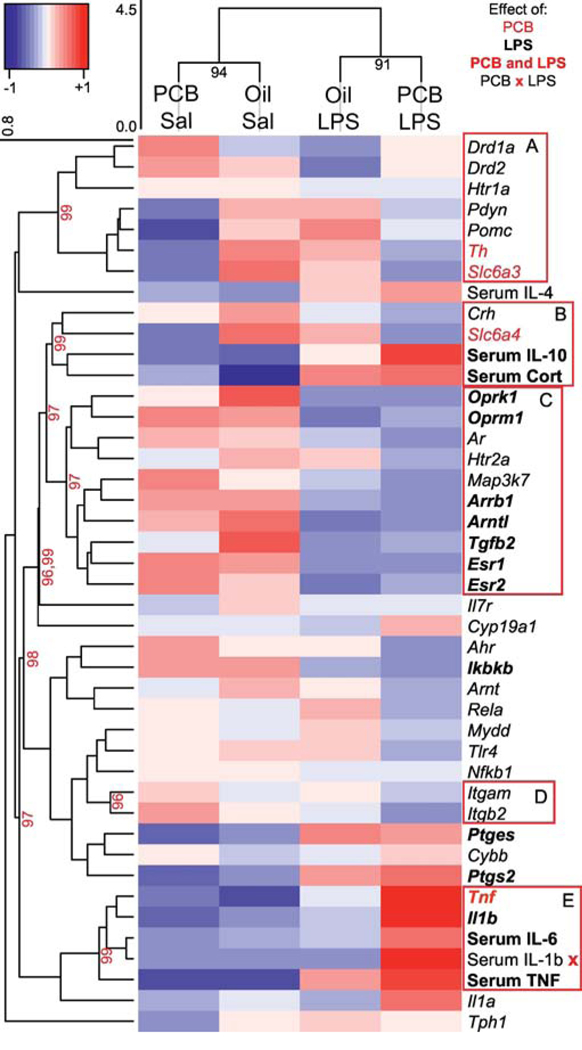
Figure 9.
Male Heatmap. Hierarchical cluster analysis using correlation coefficients of hypothalamic gene expression, serum hormones, and serum cytokines was used to create dendrograms showing relationships within the targets and groups. The height of the clusters indicates the distance between measures, and a p value (>95 is significant) and red box indicates validated clusters. For visual clarity, only highest tier significant target clusters are shown, and some large clusters are broken down into similarly significant and more functionally relevant groups. Dendrograms are linked to a heatmap showing z-scores of target expression, with red indicating highest expression and blue indicating lowest. Target labels are red if targets are significantly affected by PCBs, bold if targets are significantly affected by LPS, and both red and bold if targets are affected by both PCBs and LPS. Interactions between PCB and LPS treatments on serum IL-1b are indicated by an x.

