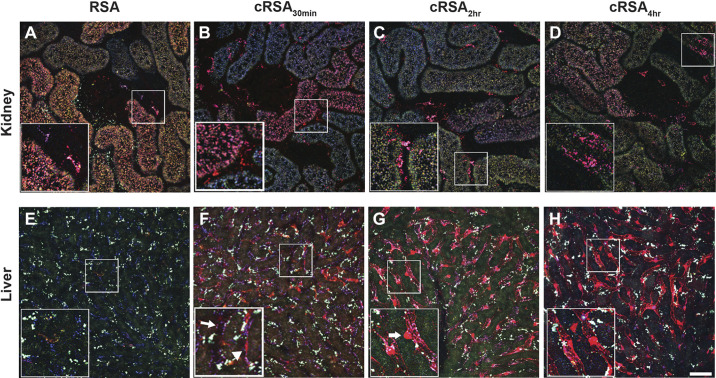
Figure 3.
Carbamylated albumin accumulates in endothelial and interstitial cells within the kidney and liver 16 h post infusion. A–D: three-dimensional (3-D)-reconstructed 30-µm images of the proximal tubule (PT) taken in vivo 16 h after infusion of 10-kDa Cascade Blue-dextran and Texas Red (TR)-labeled albumins. Accumulation in kidney interstitial areas along the peritubular vasculature and surrounding Bowman’s space revealed a 3.6-fold increase for carbamylated rat serum albumin (cRSA2h) (C) and a 2.3-fold increase for cRSA4h (D) over RSA (A). Although not readily visible in these color micrographs, circulating plasma levels of TR-RSA were still detectable in only normal RSA-treated rats; both carbamylated albumins had no discernible circulating levels within the plasma at this time point. E–H: 3-D reconstructions of matched formaldehyde-fixed liver tissue. Note the dramatic accumulation of cRSAs relative to RSA in the liver tissues. The accumulation of cRSA2h and cRSA4h (G and H, respectively) appears to clearly highlight continuous regions of the hepatic vasculature. The inset in G highlights what appears to be a Kupffer cell (arrow) localized outside the microvasculature, whereas apparent flat endothelials cells have significant accumulation contained within the vascular lumen (H, inset, right of asterisk). F: accumulation of cRSA30min. Although cRSA30min lacks the same continuous accumulation seen in G and H, the inset shows two blood vessels—one with little to no accumulation of cRSA30min (arrow) and the other with significant uptake along the vessel (arrowhead). Bars = 50 µm in full-sized images and 25 µm in enlargements. Note that the white punctate signal, more prominent in the liver, is autofluorescence. Individual channels for each figure are available (see Supplemental Fig. S2).

