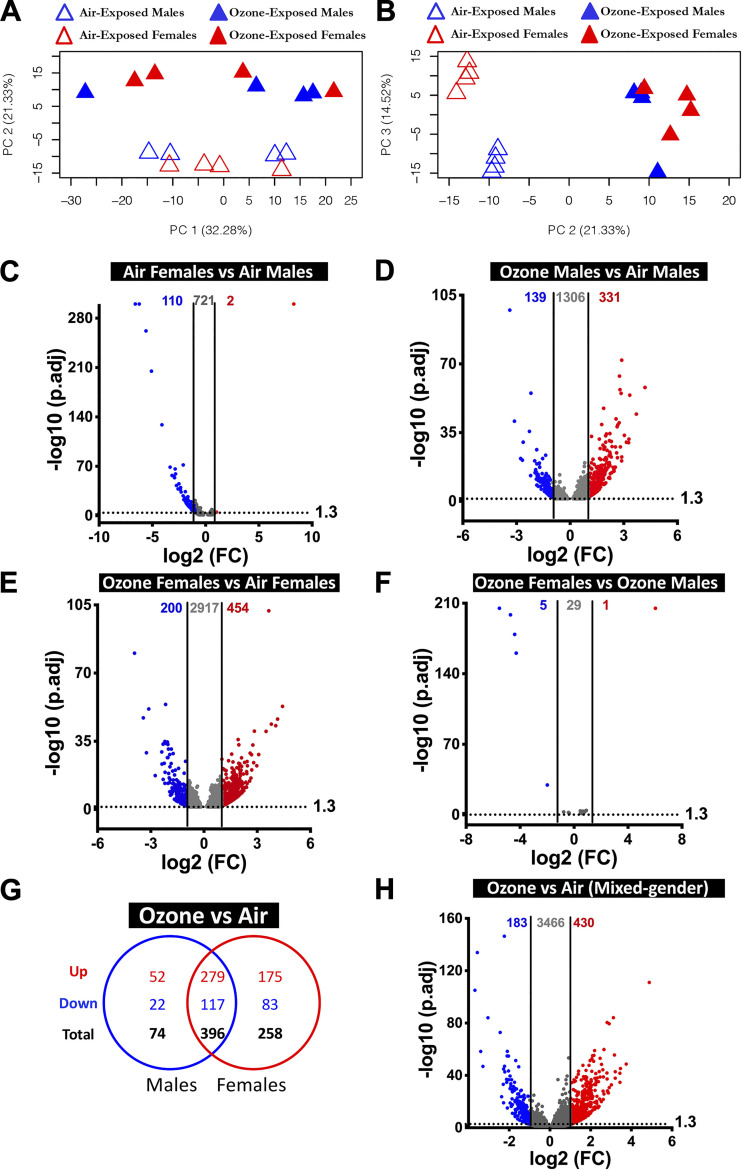
Figure 2.
Transcriptional responses in airway epithelial cell-enriched compartment. A: two-dimensional principal component (PC) analysis plot using PC1 and PC2 on all the detected genes (after normalization) in air- and ozone-exposed airways. B: two-dimensional PC analysis plot using PC2 and PC3 on all the detected genes (after normalization) in air- and ozone-exposed airways. C–F: volcano plots depicting differentially expressed genes (DEGs; upregulated and downregulated) in four different comparisons that were identified using cutoff criteria (Log2 Fold change>1, adjusted P < 0.05). C: air-exposed females vs. air-exposed males (DEGs = 112). D: ozone-exposed males vs. air-exposed males (DEGs = 470). E: ozone-exposed females vs. air-exposed females (DEGs = 654). F: ozone-exposed females vs. ozone-exposed males (DEGs = 6). (n = 4 per sex per treatment). G: Venn diagram depicting common and unique DEGs (upregulated and downregulated) in ozone-exposed males vs. air-exposed males and ozone-exposed females vs. air-exposed females. H: volcano plots depicting DEGs (upregulated and downregulated) in airways from ozone-exposed mice vs. air-exposed mice. DEG, differentially expressed genes.

