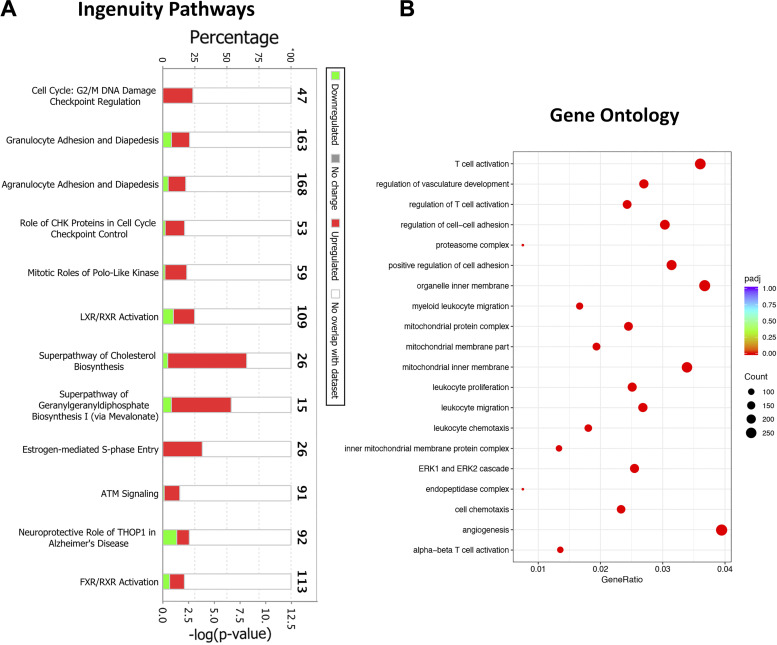
Figure 6.
Biological pathway analyses on differentially expressed genes in the parenchyma from ozone-exposed mice. A: stacked bar graph depicting enrichment of biological pathways identified using the ingenuity pathway (IP) analysis approach. B: dot plot showing enrichment of gene ontology biological processes, including biological processes, cell component, and molecular function. ATM, ataxia-telangiectasiamutated; CHK, checkpoint kinase; FXR/RXR, farnesoid X receptor/retinoid X receptor; LXR/RXR, liver X receptor/retinoid X receptor; THOP1, thimet oligopeptidase 1.

