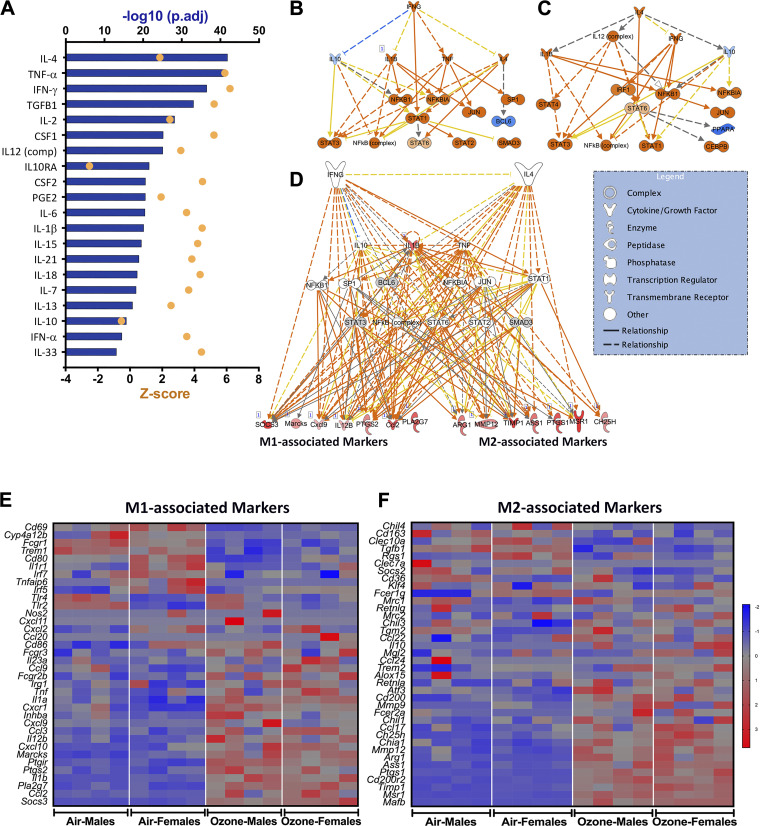
Figure 9.
Upstream regulator and differentially expressed genes (DEG) analyses reveal mixed macrophage activation patterns. A: ingenuity pathway analysis (IPA) for upstream regulators shown as a bar graph depicting upstream cytokines predicted to drive differential expression of genes in macrophages. Orange dots represent Z-score, and blue bars represent -log10 (P-adjusted) values. Mechanistic transcriptional network regulated by IFN-γ (B) and IL-4 (C). D: integrated mechanistic network depicting crosstalk between IL-4- and IFN-γ-regulated pathways and effector genes associated with classical (M1) and alternatively (M2) activated macrophages. The functional networks were generated using the Qiagen IPA analyses tool. Heat maps for normalized gene expression values (Z-scores) of classically (M1) (E) and alternative (M2) activation-associated genes (F) in purified macrophages. Higher and lower expressions of each gene are represented by red and blue colors, respectively.

