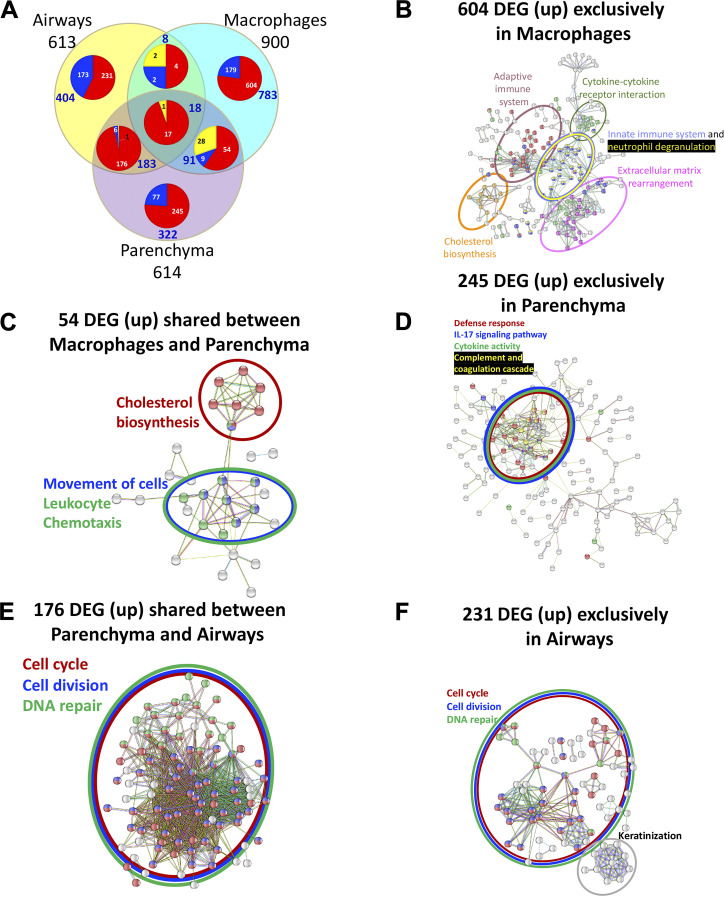
Figure 10.
Comparison of differentially expressed genes (DEGs) between three tissue compartments and their STRING analyses reveals enrichment of tissue-specific biological networks. A: integrated Venn diagram showing unique and shared DEGs across three tissue compartments in ozone-exposed mice vs. air-exposed mice. 613 (yellow-filled circle), 614 (pink-filled circle), and 900 (aqua-filled circle) DEGs from airways, parenchyma, and macrophages, were analyzed to identify the number of upregulated (depicted by red sector of the pie chart), downregulated (depicted by blue sector of the pie chart), and differentially regulated genes in the opposite direction in different tissues (depicted by yellow sector of the pie chart), respectively. The list of unique and shared DEGs between the three compartments is included in Supplemental Table S7. B: STRING database protein-protein interaction network analyses on 604 genes that were exclusively upregulated in macrophages from ozone-exposed mice vs. air-exposed mice. C: STRING database protein-protein interaction network analyses on 54 genes that were upregulated in both tissues, i.e., macrophages and parenchyma, from ozone-exposed mice vs. air-exposed mice. D: STRING database protein-protein interaction network analyses on 245 genes that were exclusively upregulated in the parenchyma from ozone-exposed mice vs. air-exposed mice. E: STRING database protein-protein interaction network analyses on 176 genes that were upregulated in both tissues, i.e., airways and parenchyma, from ozone-exposed mice vs. air-exposed mice. F: STRING database protein-protein interaction network analyses on 231 genes that were exclusively upregulated in airways from ozone-exposed mice vs. air-exposed mice. Interactions were determined on the basis of evidence, using the highest confidence level (0.9) setting.

